
Figures & data
Table 1. Baseline characteristics 29 patients who underwent RFA from January 2014 to June 2019.
Figure 1. Receiver operating characteristic (ROC) curve on the 6 months Local Tumor Progression-Free Survival (LTPFS). Area under the curve (AUC) was 0.712 (95% CI 0.61–0.82) for the largest diameter of the nodule (p.001). Based on ROC curve we choose 20 mm as the best cutoff (sensitivity 69%, specificity 70%).
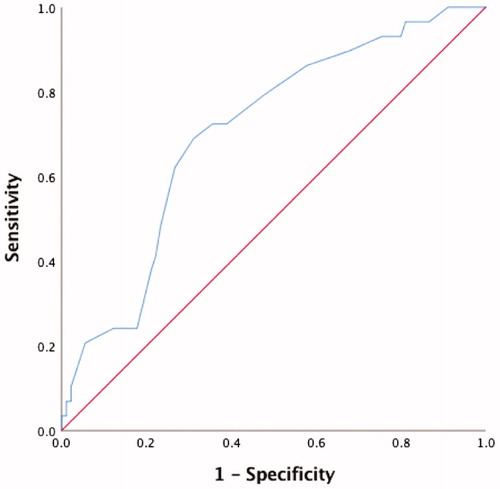
Figure 2. Local Tumor Progression-Free Survival (LTPFS) of tumors < 20 mm and ≥ 20 mm in diameter. Median LTPFS was 6.6 months (range 5.1–8.2) for lesions ≥ 20 mm and 12.9 months (range 11.5–14.2) in tumors < 20 mm.
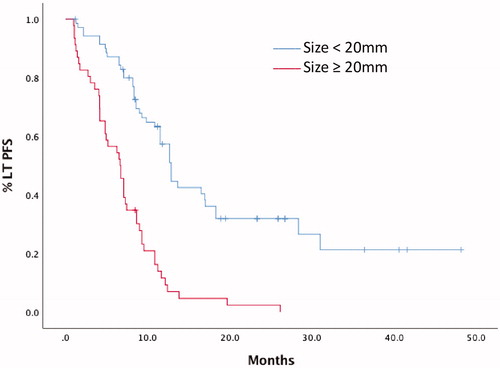
Table 2. Univariate and multivariate analysis for factors affecting LTPFS.
Figure 3. Overall Survival (OS) from the date of Radiofrequency Ablation (RFA) for all patients included.
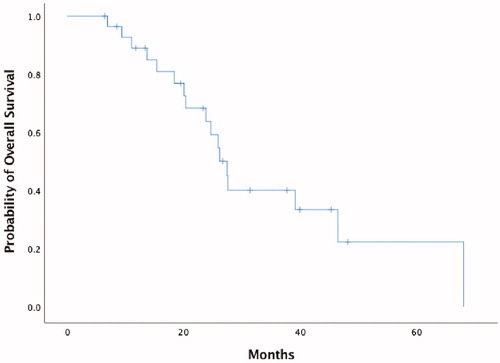
Table 3. Results of univariate and multivariate analysis for factors affecting OS.