
Figures & data
Figure 1. The flowchart of patient inclusion.
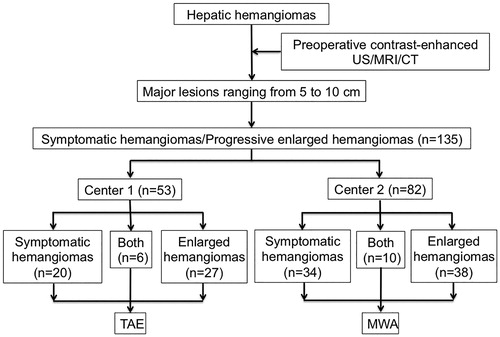
Table 1. Baseline characteristics of patients between the two study groups.
Table 2. Perioperative data between two groups.
Figure 2. Pre-MWA (a) and one-year post-MWA and (b) CT examinations show a significant reduction in size of hemangioma after MWA treatment.
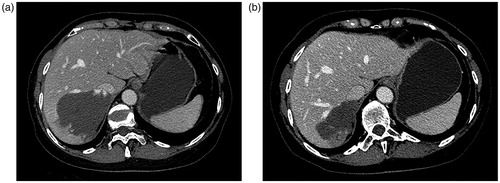
Figure 3. Pre-TAE (a) and one-year post-TAE and (b) CT examinations show a significant reduction in size of hemangioma after TAE treatment.
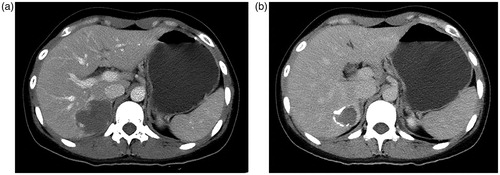
Table 3. Postoperative follow-up outcomes.
Table 4. Complications after treatment.