
Figures & data
Table 1. Patient and tumor characteristics of hepatic MWA performed using two different MWA systems.
Figure 1. Workflow for manual (left column) and semi-automatic (right column) assessment of the ablation zone.
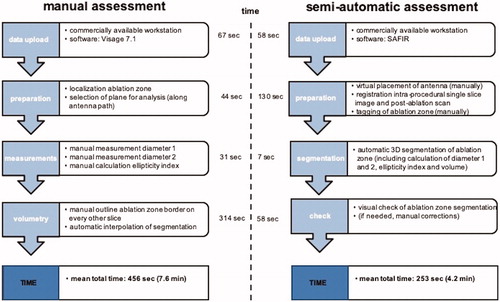
Figure 2. Comparison of semi-automatic (A–C) and manual (D) ablation zone assessment after MWA of a tumor located in the hepatic dome. SAFIR provides a VRT visualization including the position of the virtual antenna in the upper left window and multiplanar reformations (MPR) in the remaining viewer windows. (A) A line (red) corresponding to the maximal diameter of the ablation zone is drawn manually on an axial post-interventional image. In addition, transient hyperemia (white arrows) surrounding the actual ablation zone can be appreciated. (B) Initial results after automatic ablation zone segmentation (yellow) with superimposed antenna position. Notably, there is obvious incongruence between the real and the automatically segmented ablation zone, as the surrounding hyperemia has been mistakenly accounted for part of the ablation zone. (C) Final semi-automatic ablation zone segmentation result (yellow) after manual adjustments of ablation zone boundaries. (D) Manual evaluation of the ablation zone (highlighted in red) in the same patient.
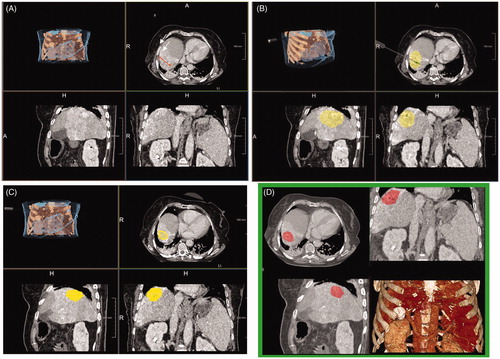
Figure 3. Ellipticity index calculation based on the maximal diameter of the ablation zone along the inserted antenna (d1, white line) divided by the maximal diameter perpendicular to the former (d2, white dashed line; A). An ellipticity index of 1 indicates a perfect spherical ablation zone, while indices smaller or greater one than 1 implies an oval-shaped ablation zone (B). MWA (10 min at 100 W) of an HCC in a 50-year-old male patient using the 2.45 GHz system (C). The ablation zone is shaped nearly perfectly spherical, as reflected by an ellipticity index of 1.1. MWA (10 min at 45 W) of a colorectal liver metastasis in a 75-year-old male patient using the 915 MHz system (D). In comparison, the resultant ablation zone has a distinct oval configuration with a respectively ellipticity index of 3.3.
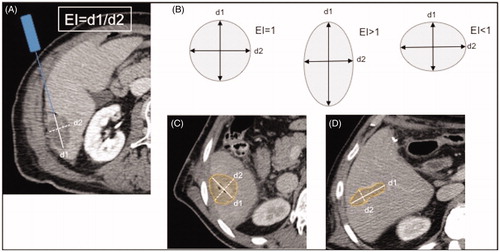
Table 2. Comparisons of ablation zone geometry using two different MWA systems.
Figure 4. Scatter plot demonstrating the results of the semi-automatic analysis on the y-axis and the results of the manual analysis on the x-axis. Shown are the respective results for ablation zone diameter 1 (A), ablation zone diameter 2 (B) and ablation zone ellipticity index (C), distinguishing also between ablations performed with the 915 MHz system (Δ) and ablations performed with 2450 MHz system (•).
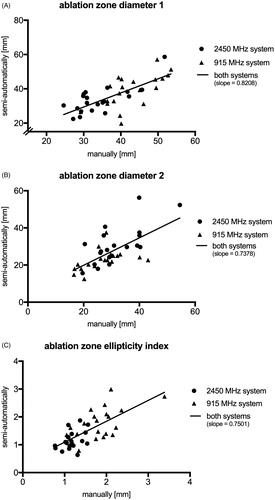
Table 3. Pearson correlation of ablation zone evaluation at manual and semi-automatic analysis in specific subgroups of patients.
Table 4. Interrater agreement regarding ablation volumetry and comparison with semi-automatic analysis.