Figures & data
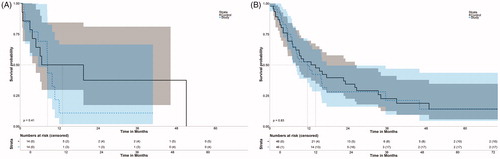
Figure 1. Flowchart of group assignment.
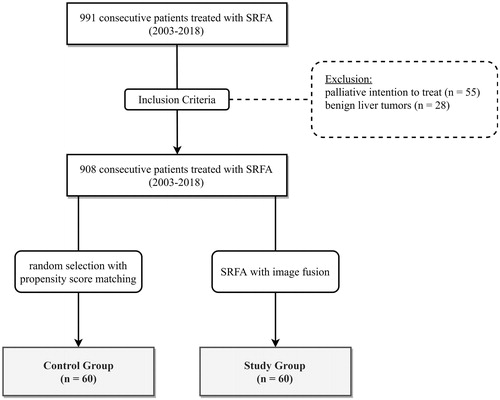
Table 1. Patient characteristics of 60 patients with 199 liver nodules undergoing 69 SRFA sessions with image fusion and of 60 patients with 229 liver nodules in 89 sessions without image fusion (control group).
Figure 2. Example images of fused images by superimposition on each other by StealthMergeTM in a patient with impaired renal function. (A, B) Showing fused images of the non-contrast enhanced planning CT with MR images of the previous day. (C, D) Corresponding fused images with 50:50 overlay (native CT and MR) (D). (E, F) Anatomical landmarks used for check of fusion (crosshair).
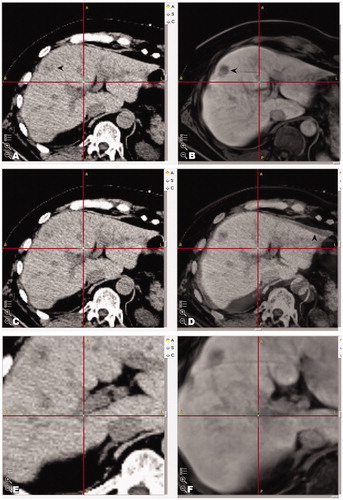
Figure 3. Case of a 71-year old male with two max. 2.4 cm large colorectal cancer liver metastases. (A) Unenhanced CT-image of an ‘invisible’ colorectal liver metastasis (black arrowhead). (B) Corresponding MR image (diffusion weighted sequence). (C) Maximum intensity projection (MIP) of the control CT with 7 coaxial needles in position. (D) Fused images of the control and planning CTs showing inserted coaxial needles and superposition of planned paths. (E, F) The black arrowheads illustrate the ablation zones on MR images at 3 months after SRFA without evidence of local recurrence.
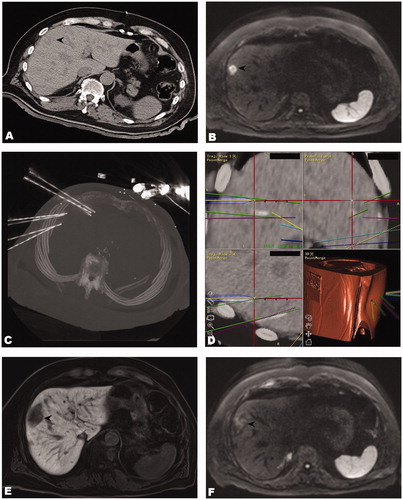
Table 2. Cases with local recurrence after SRFA.
Table 3. Tumor-based therapy success rates.
Figure 4. Overall survival after initial SRFA of patients with HCC (A) and metastatic disease (B).
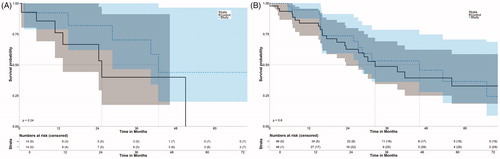
Figure 5. Disease-free survival after initial SRFA of patients with HCC (A) and metastatic disease (B).