
Figures & data
Figure 1. Geometry of the mouse bladder and the three orientations investigated. (a) The 3D computational domain developed in the present study. The bladder is shown in cyan, while the tumor is shown in red. (b) View of the computational model across the z = 0 plane. The cyan domain represents the urine. (c) The three different bladder orientations considered in the present study with respect to direction of gravity and laser irradiation. All dimensions are in mm.
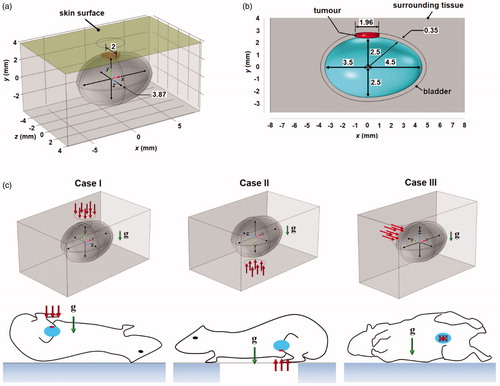
Table 1. Thermal properties employed in this study.
Table 2. Optical parameters and the peak absorption and scattering coefficients for = 0.001, 0.005 and 0.01%.
Figure 2. Plots of the (a) absorption and (b) scattering coefficients at different wavelengths calculated for ϕ = 0.001, 0.005 and 0.01%.
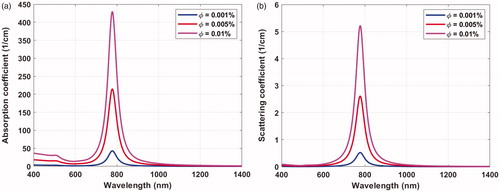
Figure 3. Fluence distribution across the z = 0 plane. Simulation was performed for three GNR volume fractions (a) = 0.001%, (b)
= 0.005% and (c)
= 0.01%. The black arrows, indicating low fluence, point to the position of the tumor. An increase in volume fraction leads to lower fluence magnitude due to higher photon absorption.
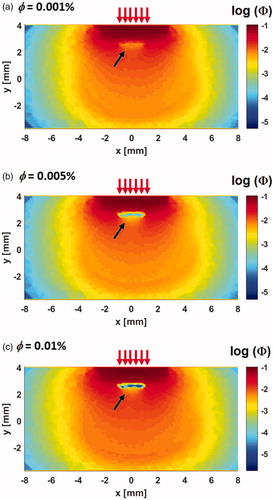
Figure 4. Contours of the temperature distribution at x = 0 and z = 0 planes 10 min after laser exposure. (a) Case I, (b) Case II, (c) Case III, and (d) Case IV. The temperature distribution inside the bladder is visualized using isothermal surfaces in order to show the flow-induced variation. Results were obtained for = 0.001% and
= 0.2 W. The yellow arrows show the direction of gravity and the red arrows show the flow field. Figures indicate significant changes in the isotherms inside the bladder due to natural convection under different bladder orientation.
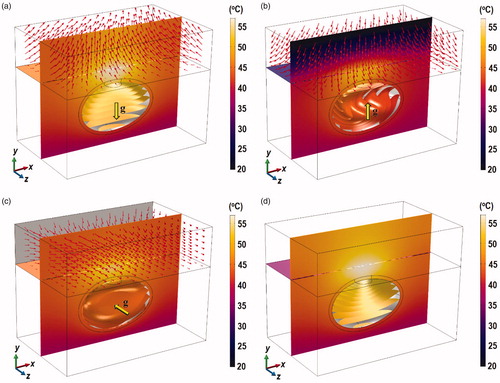
Table 3. Results for the different configurations for = 0.001% and Plaser = 0.2 W .
Figure 5. Contours of the velocity magnitude in mm/s and the velocity vector inside the bladder plotted for z < 0 at t = 10, 20, 30, 60, and 600 s. (a) Case I, (b) Case II, and (c) Case III.
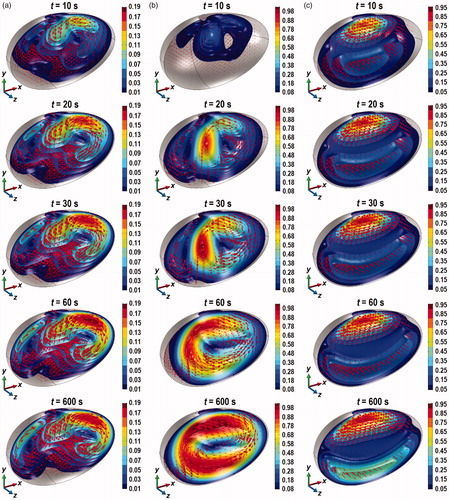
Figure 6. Contours of PD across the tumor, the bladder and the surrounding tissue at the z = 0 plane, the skin surface (for z < 0) and the inner wall of the bladder, 10 min after the start of laser irradiation. (a) Case I, (b) Case II, (c) Case III, and (d) Case IV, for ϕ = 0.001% and laser power of 0.2 W. Inset: enlarged view of the tumor and the tissue above it.
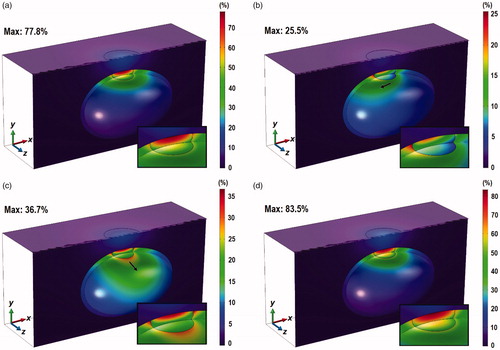
Figure 7. Plots of maximum PD values against time inside the tumor and the bladder for (a) = 0.001%, (b)
= 0.005% and (c)
= 0.01% for
= 0.2 W.
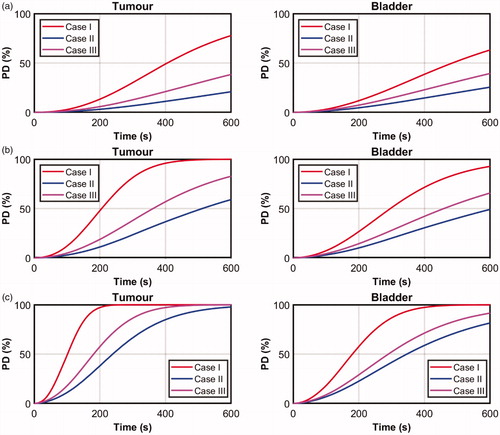
Figure 8. Contours of PD across the tumor, the bladder and the surrounding tissue across the z = 0 plane, the skin surface (for z < 0) and the inner wall of the bladder after 10 min of 0.2 W laser irradiation. (a) ϕ = 0.005% and (b) ϕ = 0.01%. Inset: enlarged view of the tumor and the tissue above it.
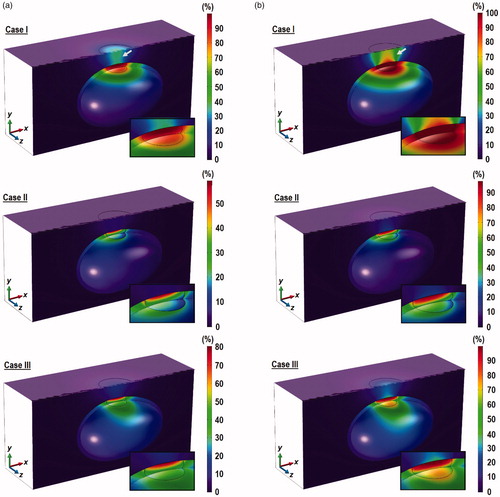
Figure 9. Contours of PD across the tumor, the bladder and the surrounding tissue at the z = 0 plane, the skin surface (for z < 0) and the inner wall of the bladder after 10 min of 0.3 W laser irradiation. (a) ϕ = 0.001%, (b) ϕ = 0.005% and (c) ϕ = 0.01. Inset: enlarged view of the tumor and the tissue above it.
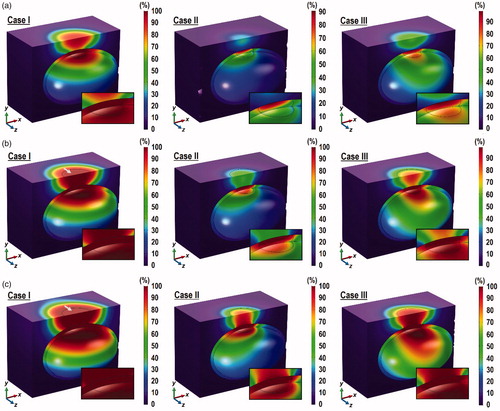
Table 4. Values of
and
obtained for Cases I, II, and III for different laser power and GNR volume fraction.
Figure B1. Results from mesh convergence study, where the different bars represent the values obtained at different sampled points.
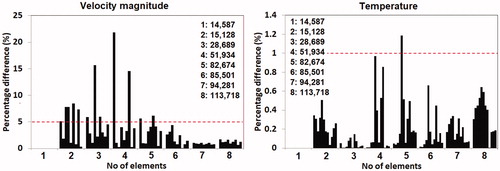
Figure C1. Results from the model verification study for GNR concentration of 100 µg/ml.
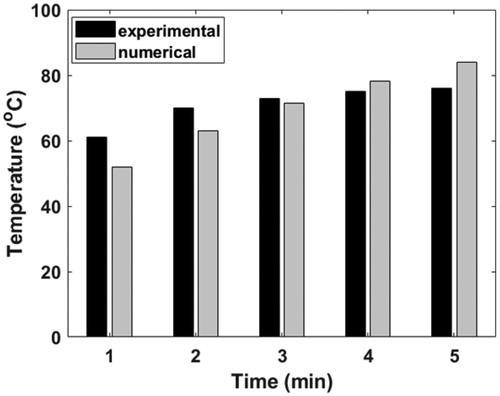
Table C1. Results from the model verification study against the work of Terentyuk et al. [Citation45].