Figures & data
Figure 1. Laser ablation of glioma. (A) A Pubmed search for ‘laser’ and ‘glioma’ shows a striking increase in the number of publications over the past two decades. (B) Example of recurrent GBM in the corpus callosum. (C) This callosal tumor was treated with LITT at our institution. This image was captured with live MR thermography during the ablation. The white target is located on the expanding border of the predicted cell kill zone (blue contour line) and has reached a temperature of 44.5 °C. Higher temperatures were generated within the area outlined by the contour line.
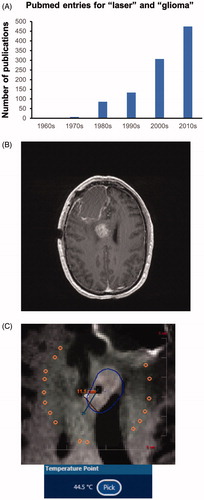
Figure 2. Flow cytometry protocol. We used a series of gates based on side scatter (SSC) and forward scatter (FSC) to isolate single dissociated cells for analysis of their DAPI and annexin V − PE fluorescence. The far right dot plot in the top row is used as an example in the bottom row to illustrate the populations of cells we analyzed: DAPI+, annexin V+, and DAPI+/annexin V−.
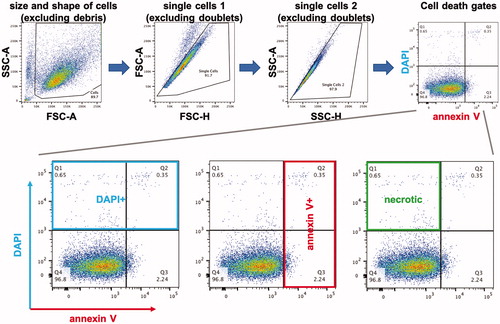
Figure 3. Heating GBM cells to 49 °C increases DAPI and annexin V staining. Representative flow cytometric analysis of GBML20 and GBML61 cells for DAPI and annexin V staining after heating to 49 °C for 30, 60 or 180 min.
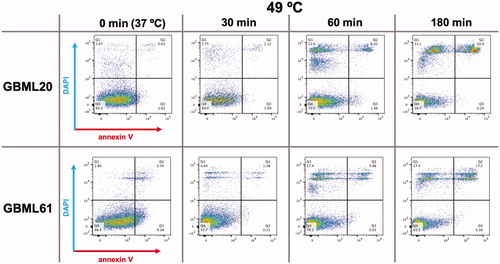
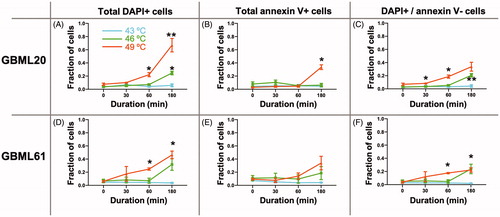
Figure 4. Heat induces a predominantly non-apoptotic death in GBM cells in vitro. Summary graphs of effects of three different temperatures applied for 30, 60 or 180 min to two patient-derived GBM cultures on DAPI and annexin V staining (A–F). The DAPI + and DAPI+/annexin V − cell populations show the most statistically significant increases in response to heat in a temperature and time-dependent manner. Two-way ANOVA was used for statistical comparisons. The effect of temperature was significant in all conditions with the exception of annexin V staining for GBML20 (B) (F2,10 = 2.160, p = 0.1661) and GBML61 (E) (F2,10 = 1.291, p = 0.3170). Time, and the interaction of temperature–time were significant in all conditions. Asterisks indicate post-hoc significant differences by Tukey test. *p < 0.05; **p < 0.01.