
Figures & data
Figure 1. (A) Chest CT image before ablation therapy shows a tumor with the maximum diameter of 15 mm. (B) CT image during MWA shows the antenna inserted into the tumor. (C) Follow-up CT scan after 1 month shows air inside the tumor and is evaluated as complete ablation. (D) Contrast enhanced MRI scan after 2 month shows marked involution of the tumor without contrast enhancement.
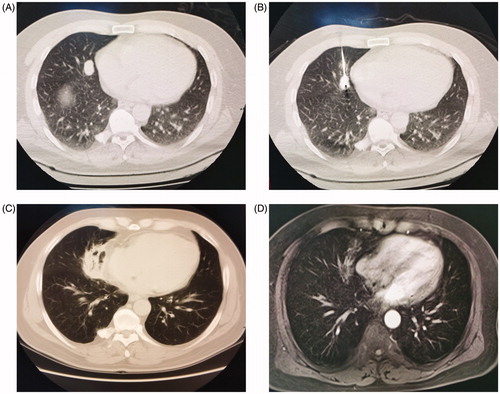
Table 1. Demographic and clinical characteristics of included patients.
Table 2. Tumor response at 1 month after ablation therapies.
Figure 2. The Kaplan–Meier estimates of survival for all included patients. (A) The OS rates of all patients with pulmonary metastases (PM) from hepatocellular carcinoma (HCC) treated with thermal ablation. (B) The local progression-free survival rates of all patients with PM from HCC treated with thermal ablation.
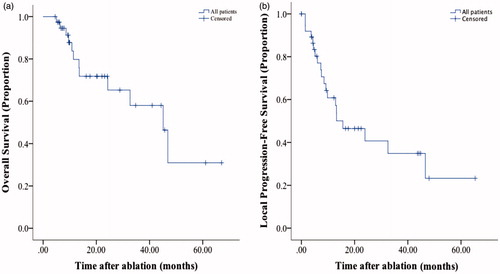
Figure 3. The Kaplan–Meier estimates of survival for patients in different subgroups. (A) and (C): The overall survival (OS) rates and local progression-free survival (LTPFS) rates of patients with ≤2 or >2 PMs. (B) and (D): the OS rates and LTPFS rates of patients with unilateral or bilateral PM.
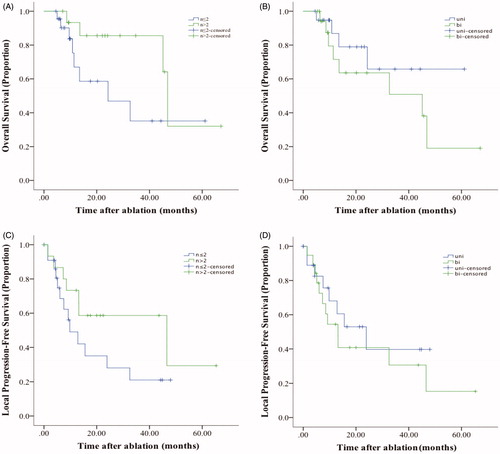
Table 3. Subgroup analysis for overall survival rate, local tumor progression-free survival rate and complete response rate.
Table 4. Univariate and multivariate analysis of all included patients for overall survival in Cox proportional hazard model.