Figures & data
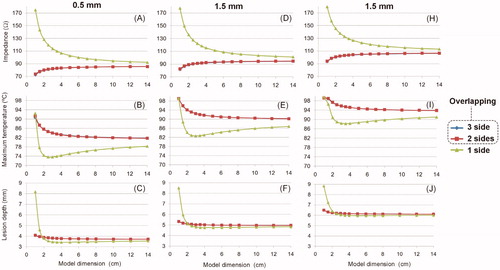
Figure 1. (A) Full thorax model and limited-domain model used to study RF cardiac ablation. (B) In the limited-domain model only a portion of the electrical circuit between active electrode and dispersive electrode is considered. The part of the total power delivered by the RF generator (P0 = V0 × I0) that is applied to a limited-domain model is PMOD = I02 × ZMOD.
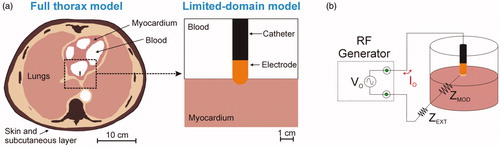
Figure 2. (A) Cross-section of a CT medical image which was segmented to identify zones associated with the different tissue types (image retrieved from [Citation19], ID 71813). (B) Model geometry resulting from the previous segmentation (scale represents electrical conductivity in S/m).
![Figure 2. (A) Cross-section of a CT medical image which was segmented to identify zones associated with the different tissue types (image retrieved from [Citation19], ID 71813). (B) Model geometry resulting from the previous segmentation (scale represents electrical conductivity in S/m).](/cms/asset/8b8bafd2-af07-42c9-bb1c-52217820a5bf/ihyt_a_1777330_f0002_c.jpg)
Figure 3. (A) 2D model mesh. (B) Detail of mesh around the active electrode.
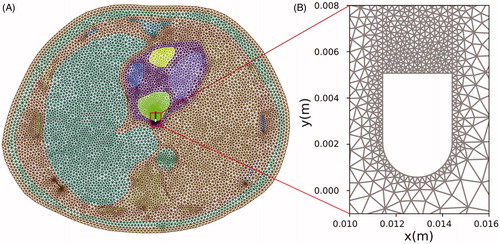
Table 1. Electrical characteristics of the tissues included in the models.
Figure 4. (A) Cross section of the fourth 3D model geometry. (B) The structures were immersed in a thorax with realistic boundaries. The dimensions of the model are: T = 30 cm, D = 42 cm, and H = 18 cm. (C) Zone 3 with radius of 8 cm (Zones 1 and 2 were concentric). (D) Zone 5 covers the dispersive electrode.
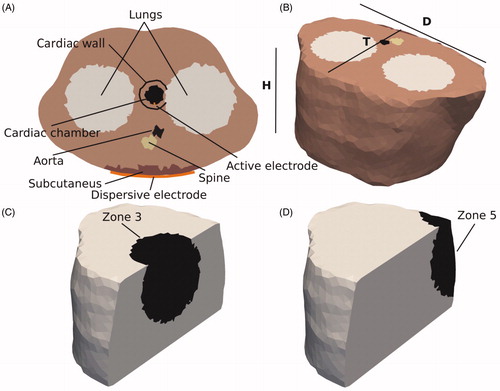
Figure 5. Details of the meshing used in the full thorax model. (A) Cross section at the level of the active electrode. Dotted line represents approximately the contour of the subcutaneous tissue. (B) Close-up of the zone around the active electrode. (C) Posterior view showing the meshing and position of the elements (yellow) on which an electrical condition of zero voltage was set, mimicking the location of the dispersive electrode.
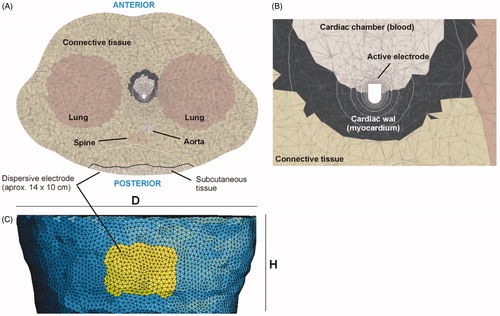
Figure 6. (A) 2D limited-domain model (out of scale) comprised of two fragments: cardiac tissue and blood, both squares of side X (varying between 4 and 8 cm). (B–D) Options to set the electrical boundary condition of 0 V: only on the bottom (B), bottom and side (C), bottom, side and top (D).
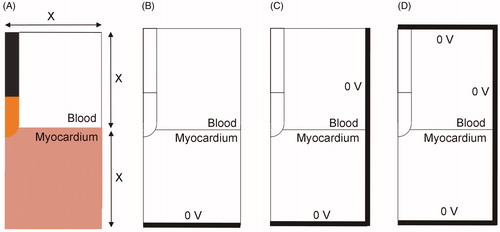
Figure 7. (A) Current density distribution (in A/m) across the thorax computed by the 2D model. (B) Detail around the active electrode.
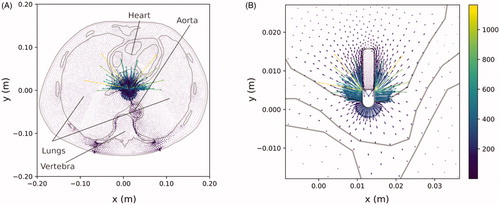
Figure 8. Profile of percentage power absorbed in each zone of the thorax for the seven 3D models studied (which were built on the basis of adding different types of tissues and organs to an initial model based on homogeneous tissue). These results were from an electrode insertion depth of 1.5 mm (similar results were obtained for other values of 0.5 and 2.5 mm).
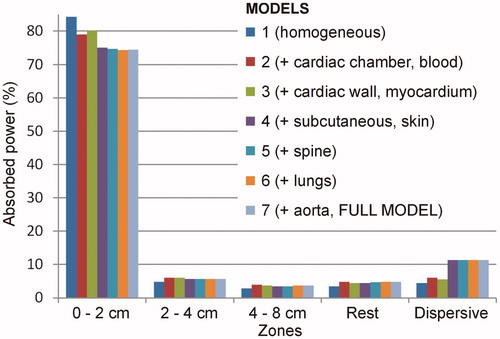
Figure 9. Impedance (A) and percentage of power absorbed in a 4 cm radius sphere around the electrode (B) at three insertion depths (0.5, 1.5 and 2.5 mm) and for seven full-thorax models built by progressively adding organs and tissues: 1 (homogeneous), 2 (+ cardiac chamber), 3 (+ cardiac wall), 4 (+ subcutaneous and skin), 5 (+ spine), 6 (+ lungs) and 7 (+ aorta).
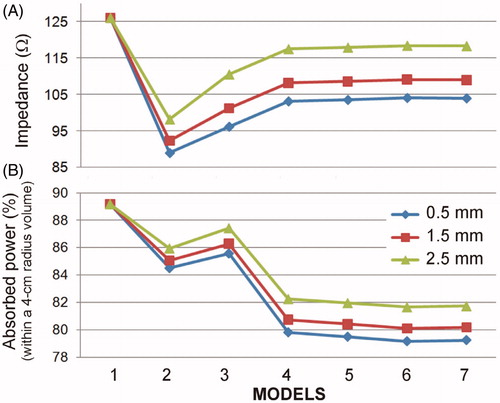
Figure 10. Effect of the dimensions of a 2D limited-domain model on initial impedance, maximum temperature and lesion depth (assessed with the 55 °C isotherm) after a 15-W 30-s RF cardiac ablation. The columns show the insertion depth of the active electrode (0.5, 1.5 and 2.5 mm). The three lines (blue and red overlap) are the location of the zero-voltage electrical boundary condition (see ).