
Figures & data
Figure 1. Flowchart of patient enrollment.
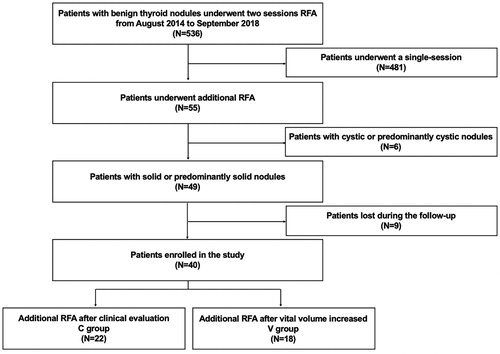
Table 1. Comparisons between the two groups before RFA.
Table 2. Comparisons of the first and additional RFA between the two groups.
Figure 2. The changes of VRR at each follow-up point after additional RFA.
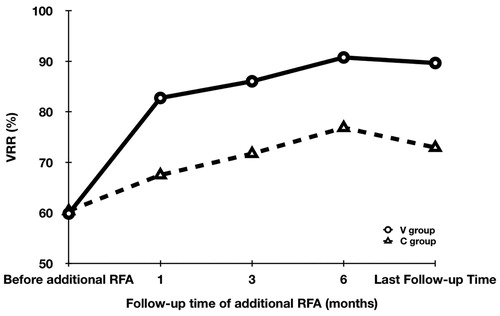
Figure 3. The conventional US and CEUS images of a 41-year-old male in the V group during each ablation (A) A solid nodule located in the right thyroid before treatment with an initial volume of 6.07 ml. (B) At 1 month after the first RFA, the total volume was 2.61 ml and VRR was 57.00%. CEUS showed residual vital tissues located in the peripherally area (arrow). The vital volume was 2.09 ml. (C) At 3 months after the first RFA, the total volume was 1.21 ml and VRR was 80.07%. CEUS showed the vital volume 1.12 ml. (D) At 6 months after the first RFA, the total volume enlarged to 1.79 ml and VRR was 70.51%. Vital volume increase was found in CEUS, which was 1.78 ml. Additional RFA was performed. (E) At 3 months after additional RFA, the total volume was 0.67 ml and VRR was 88.96%. (F) At 6 months after additional RFA, the total volume decreased to 0.11 ml and VRR was 98.19%.
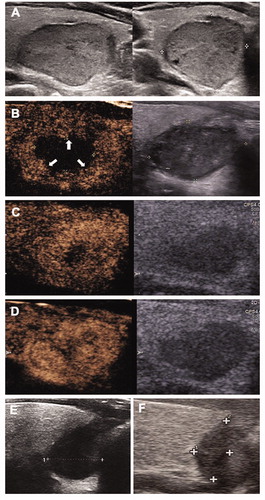
Figure 4. The conventional US and CEUS images of an 18-year-old female in the C group during each ablation (A) A solid nodule located in the right thyroid before treatment with an initial volume of 8.44 ml. (B) At 1 month after the first RFA, the total volume was 3.36 ml and VRR was 60.19%. CEUS showed residual vital tissues located in the peripherally area (arrow). The vital volume was 1.68 ml. (C) At 6 months after the first RFA, the total volume was 1.52 ml and VRR was 81.99%. CEUS showed the vital volume was 1.24 ml. Additional RFA was performed. (D) At 6 months after additional RFA, the total volume decreased to 0.85 ml and VRR was 89.95%.
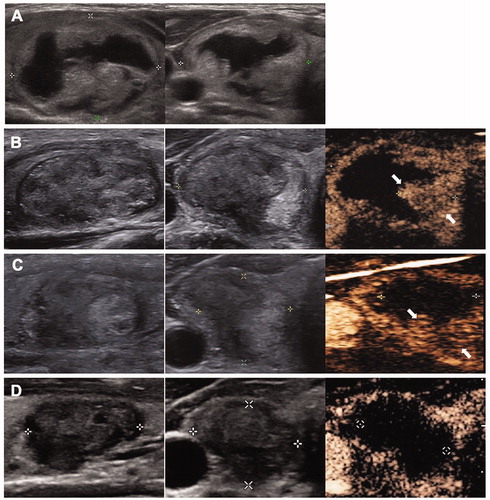
Table 3. Changes of VRRs and VRR2nd at each follow-up period after additional RFA.