
Figures & data
Table 1. Comparison of included and excluded characteristics.
Table 2. Baseline characteristics of groups 1–4 and pairwise comparison between groups 1–3 and group 4.
Table 3. Prognostic outcomes for groups 1–4.
Figure 1. The cumulative overall survival of group 1 (<55 years), group 2 (55–64 years), group 3 (65–74 years), and group 4 (≥75 years). The log rank test showed a significant difference among the 4 groups (p < 0.001). Pairwise statistical difference existed between group 1, 2 and 4 (p = 0.002, 0.013).
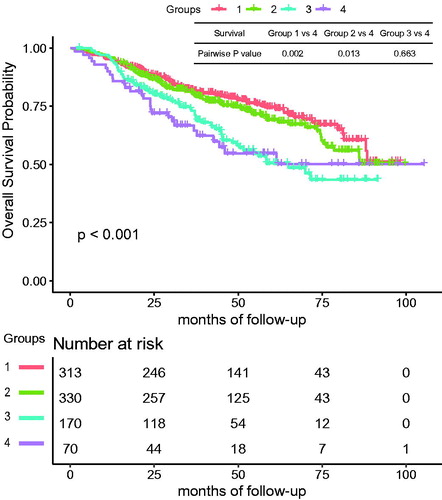
Table 4. Baseline characteristics of Group Y (<75 years) and Group S (≥75 years).
Table 5. Prognostic outcomes before and after matching.
Figure 2. The cumulative overall survival of Group Y (<75 years) and Group S (≥75 years) after propensity matching. The log rank test showed no significant difference between the two groups (p = 0.784).
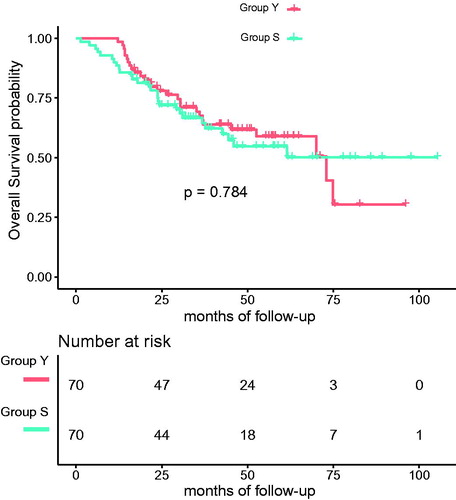
Table 6. Univariate and multivariate Cox regression analyses of overall survival of the patients from Group Y and S.