Figures & data
Figure 1. (A) Experimental setup. The pigs were positioned on the patient table in prone position. The abdomen was compressed using a custom-made hydrogel spacer (B) inserted between the animal and the table’s acoustic membrane.
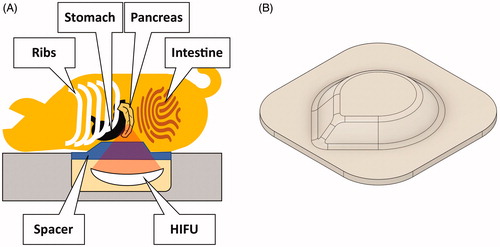
Table 1. Composition of the spacers used in this study.
Figure 2. Explanations for the absence of coagulative necrosis at the target location of the pancreas (right column) and supporting evidence (left column). The complete absence of damage may be due to off-target sonication or an obstruction of the beam path.
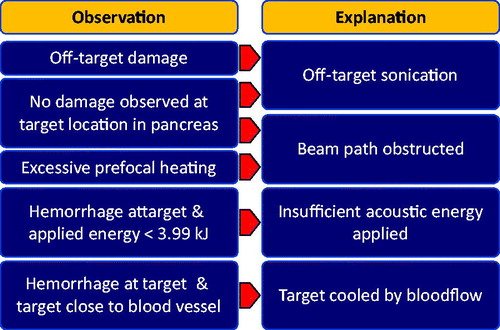
Table 2. Sonication results overview.
Figure 3. Snapshots of thermometry maps acquired during sublethal sonications. (A) Sonication 1/1: offset of thermal dose profile in focus slice and prefocal heating in sagittal slice. (B) Sonication 1/2: strong focal heating despite small amount of delivered energy and irregular shape of heated volume. (C) Sonication 2/2: motion artifacts due to respiration in focus slice; insufficient heating measured in sagittal slice before movement. (D) Sonication 3/2: signal void indicative of air or solid near focus observed in focus slice and strong prefocal heating in sagittal slice. (E) Sonication 5/2: limited heating in the focus, only mild prefocal heating. (F) Sonication 5/2: proximity of the target area to the portal vein likely prevented sufficient heating for the creation of a thermal lesion.
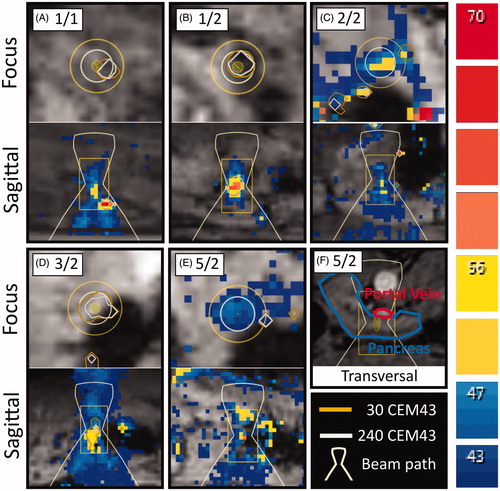
Figure 4. Representative images of the different degrees of thermal damage induced by HIFU in the porcine pancreas, from sample 4/2. The scale bars in the subfigures represent 50 µm. (A) Center of the focal area, exhibiting coherent cells with fragmented nuclei and no hemorrhage. (B, C) Border region, exhibiting a loss of cohesion between cells and hemorrhage. (D) Healthy pancreas parenchyma.
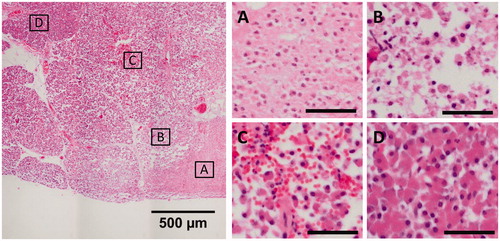
Figure 5. Fixated pancreas samples. Red arrows indicate thermal lesions of coagulative necrosis. Yellow arrows indicate non-ablative tissue damage.
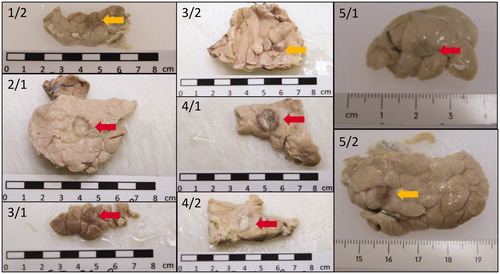
Figure 6. Predictive power of different parameters for the lesion size found in gross examination after fixation. Lesion size versus (A) applied acoustic energy, (B) delivered acoustic energy. Measurement of the lesion size via (C) temperature threshold monitoring (57 °C), (D) thermal dose monitoring (240 CEM43), and (E) post-treatment contrast enhanced MRI. OLS: ordinary least squares; MSD: mean squared deviation; NPV: non-perfused volume.
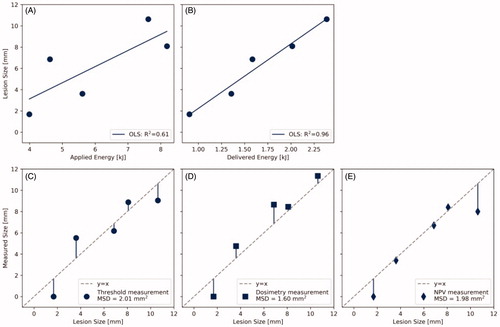
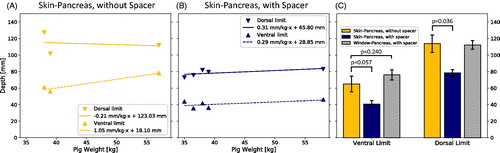
Figure 7. (A) Depth of the pancreas from the skin without a spacer (n = 3) and (B) the depth from the skin with a spacer (n = 5) versus animal weight. (C) Side-by-side comparison of ventral and dorsal limits. Probability values were obtained using Welch’s t-test.