
Figures & data
Figure 1. Experimental setup. (A) Swine on CT Table with articulating arm (red arrow) to which ultrasound transducer is affixed extending from table and RF antenna (black arrow) secured in place. (B) View of liver surface with ultrasound transducer (green arrow) affixed to the articulating arm (red arrow) perpendicular to the plane of the RF antenna (black arrow).
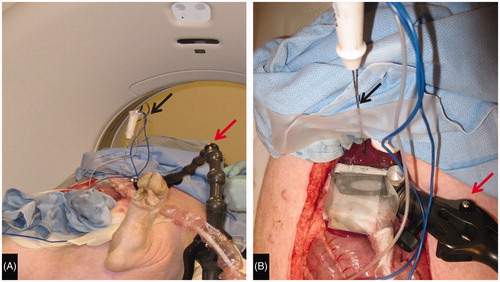
Figure 2. Sagittal (A), Axial (B), and coronal (C) planes through the ultrasound transducer (arrow A–C) created with multiplanar reconstruction. The coronal plane (C) was used to replicate the ultrasound plane by aligning the axial plane (purple line) with the ultrasound transducer face. This allowed equivalent in plane gas and hypoattenuating zone measurements of the ablation zone (arrowhead A, C).
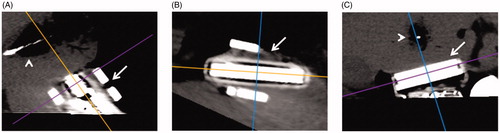
Figure 3. Measurement of gas zones at completion of ablation on CT (A), US (B), and with a corresponding tissue slice stained with NBT (C). A hypodense zone in (A) and hypoechoic zone in (B) are seen to correlate with the pathologic margin in (C) (blue arrows). On NBT-stained whole mount (C) note the difference between tan-brown char of ablation zone (red arrow) and viable red-purple liver (yellow arrow)
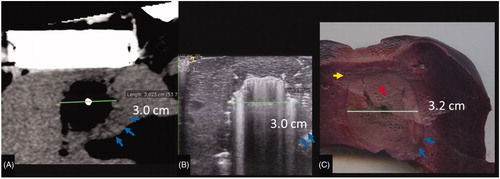
Figure 4. CT slice with MW gas zone outline (green oval). The gas zone was outlined using semi-automated software and edges confirmed on contiguous axial images to define the volumetric extent of the zone of visible gas. A corresponding volume rendered composite (bottom right image) created and the resultant volume output (bottom left corner) was recorded.
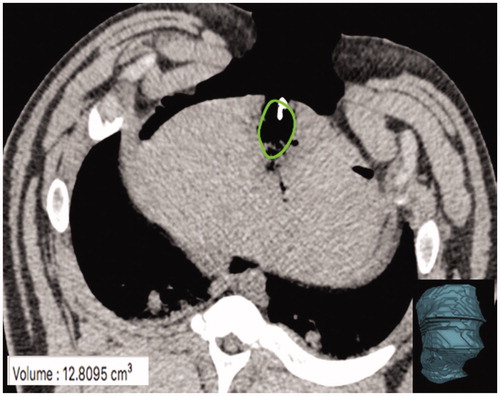
Figure 5. US (top) vs. CT (bottom) intra-procedure images of RF ablation at each point of image recording in the experiment. Note how the zone of visible gas is most pronounced at 1 and 3 min (yellow arrow) with minimal visible gas 5 min into the ablation. Similarly, gas is most notable at 1 and 3 min on CT (red arrows) with more dissipated gas at 5 min. A hypoechoic zone is noted at 3 and 5 min on the ultrasound (blue arrows), while the hypodense zone at CT is difficult to visualize.
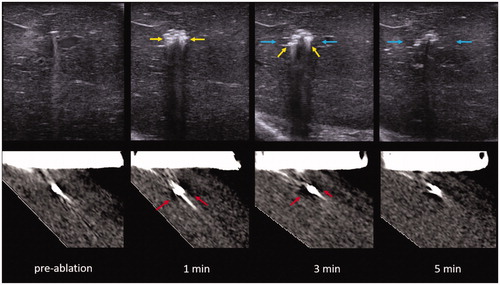
Figure 6. US (top) vs. CT (bottom) intra-procedure images of MW ablation. Yellow arrows describe the zone of gas while red arrows indicate the hypoechoic/hypodense zone. Note the easy visibility of gas within the ablation zone on both ultrasound and CT while the hypodense zone is subtle, particularly on CT. These images also demonstrate the continually visible growth of the zone of out-gassing.
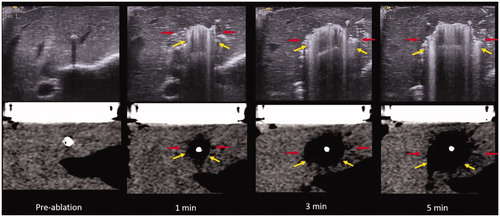
Figure 7. Graph demonstrating change in mean ablation diameter of gas and hypoechoic/hypoattenuating zone on CT (A) and US (B) during the ablation.
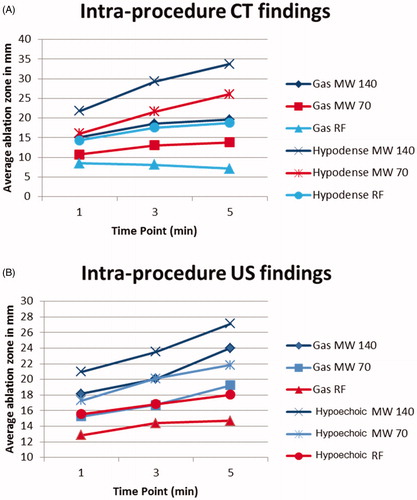
Table 1. Mean absolute difference between imaging findings at the completion of ablation and pathology.
Figure 8. US (top) vs. CT (bottom) images of the MW ablation zone post-procedure. Yellow arrows describe the zone of gas while red arrows indicate the hypoechoic/hypoattenuating zone. (Note that the hypoattenuating zone is subtle on CT.) Note the relatively rapid resolution of the zone of visible gas on both ultrasound and CT.
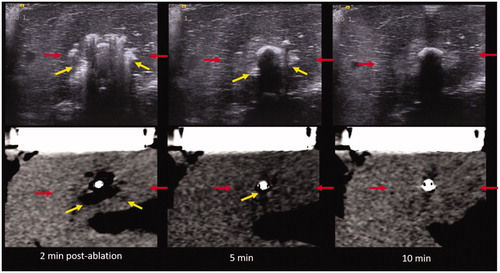
Table 2. Mean diameter (range, mm) at the completion of ablation and at each post-ablation time point (note: MW numbers include ablation performed at 70 W and 140 W).