Figures & data
Table 1. Participants’ anthropometric characteristics.
Table 2. Glycemia and mean arterial blood pressure before and after the meal in the two environmental conditions.
Figure 1. Skin blood flow (PU) and its determinants in response to local heating in women before (solid line) and after (dashed line) the meal at 20 °C (gray line) and at 31 °C (black line). (A) Skin blood flow (PU) phases (p < .001); temperature (p < .001); temperature x phase (p = .002); meal x temperature (p = .01); all other p > .13. (B) Velocity (VU) phases (p < .001); temperature (p < .001); meal x temperature (p < .001); all other p > .29. (C) Concentration of moving blood cell (CU) phases (p < .001); temperature x phase (p = .02); all other p > .20. Post-hoc velocity results are identified as follows: *Significant difference as compared with baseline phase in the same meal state and environmental condition. #Significant difference as compared with the pre-prandial state in the same environmental condition. +Significant difference as compared with the control temperature.
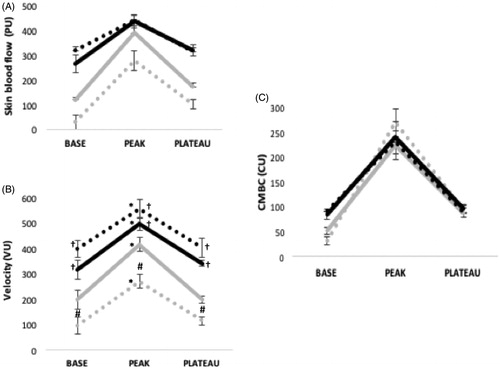
Figure 2. Skin blood flow (PU) and its determinants in response to local heating in men before and after food intake (A) Skin blood flow phases (p < .001); temperature (p < .001); meal (p = .007); temperature x phases (p < .001); all other p > .40. (B) Velocity (VU) phases (p < .001); temperature (p <.001); meal (p < .001); temperature x phase (p < .001); meal x temperature (p = .001); meal x phase (p < .001); temperature x phase x meal (p = .60). (C) Concentration of moving blood cell (CU) phases (p <.001); temperature (p = .006); temperature x phase x meal (p < .001), all other p > .16.
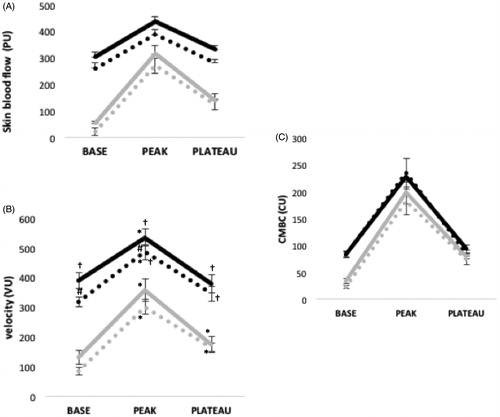
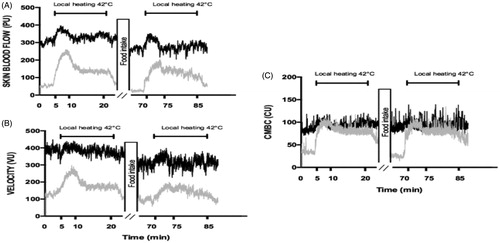
Figure 3. Skin blood flow (PU) and its determinants in response to local heating in women before and after the meal at 20 °C (gray line) and at 31 °C (black line).
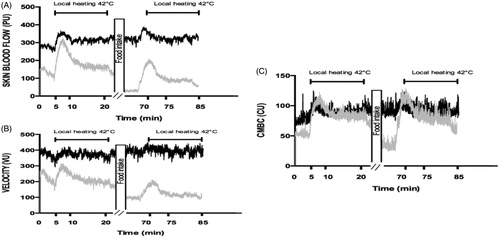
Figure 4. Skin blood flow (PU) and its determinants in response to local heating in men before and after the meal at 20 °C (gray line) and at 31 °C (black line).