
Figures & data
Figure 1. Flowchart of the literature search. A literature search was undertaken according to the PRISMA guidelines. A total of 998 studies were identified, of which 9 studies were included in the meta-analysis after screening.
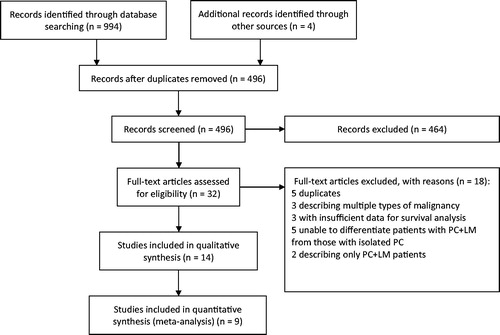
Table 1. Characteristics of the selected studies.
Figure 2. Median OS for different patient groups in the 9 included studies. Each circle represents one study group, with the name of the first author labeled in the center. The red font indicates a statistically significant difference in OS between the 2 groups. Blue and yellow circles represent the PC + LM and PC groups, respectively. The size of the circle represents the number of patients in the corresponding group.
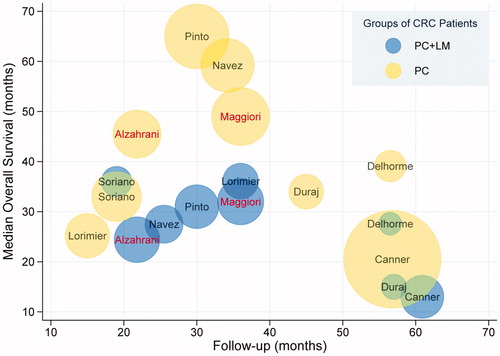
Figure 3. Median DFS in the different patient groups in the 9 included studies. Each circle represents one study group, with the name of the first author labeled in the center. The red font indicates a statistically significant difference in DFS between the 2 groups. Blue and yellow circles represent the PC + LM and PC groups, respectively. The size of the circle represents the number of patients in the corresponding group.
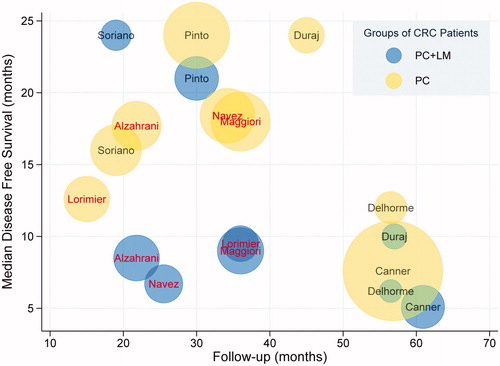
Table 2. Clinical outcomes of the selected studies.
Figure 4. Forest plots regarding OS and DFS. The pooled HR for OS was 1.68 (95% CI 1.33–2.13, p < 0.01) and the pooled HR for DFS was 1.82 (95% CI 1.51–2.20, p < 0.01). Both results indicated better survival in the PC group compared with the PC + LM group.
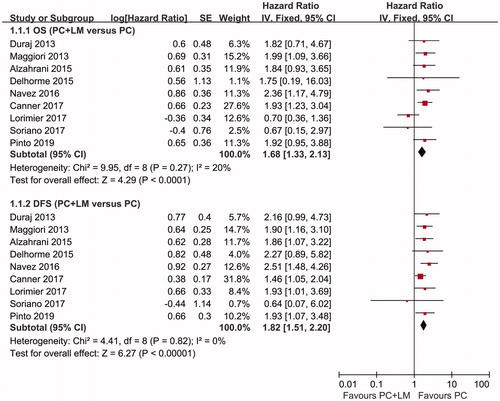
Figure 5. Forest plots of recurrence. Pooled RRs concerning overall recurrence, hepatic recurrence, and peritoneal recurrence were 1.22 (95% CI 1.04–1.44, p = 0.02), 2.29 (95% CI 0.98–5.37, p = 0.06), and 0.95 (95% CI 0.60–1.51, p = 0.82), respectively. A fixed-effect model was used to calculate the RR of overall and peritoneal recurrence, whereas a random-effects model was used to calculate the RR of hepatic recurrence. The results of the analysis showed a higher risk of tumor recurrence in the PC + LM group.
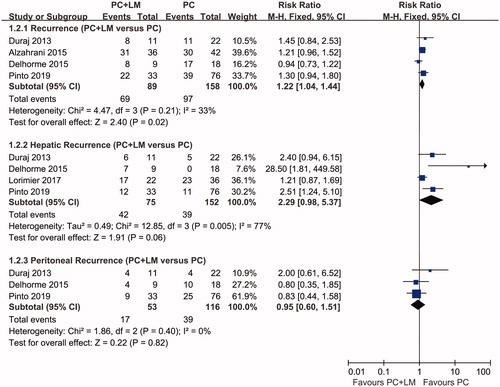
Figure 6. A Forest plot of postoperative mortality and major morbidity. The pooled RR of postoperative mortality was 1.76 (95% CI 0.73–4.23, p = 0.21) and the pooled RR of major postoperative morbidity was 1.47 (95% CI 1.19–1.82, p < 0.01). The results indicated a higher morbidity during the early period postoperatively in the PC + LM group, whereas there was no statistically significant difference in mortality between the 2 groups.
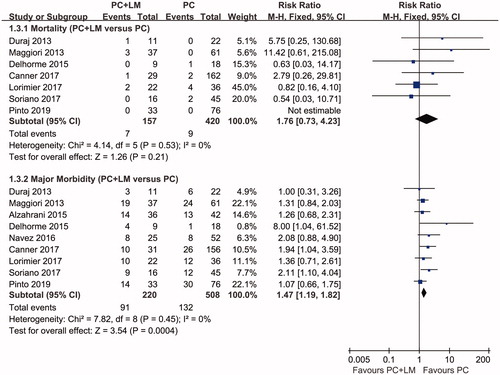
Table 3. Results of tests for funnel plot asymmetry.