Figures & data
Figure 1. Flowchart of patient recruitment. Abbreviations: HCC: Hepatocellular carcinoma; RFA: Radiofrequency ablation; LTP: local tumor progression; IHM: intrahepatic distant metastasis; EHM: extrahepatic metastasis.
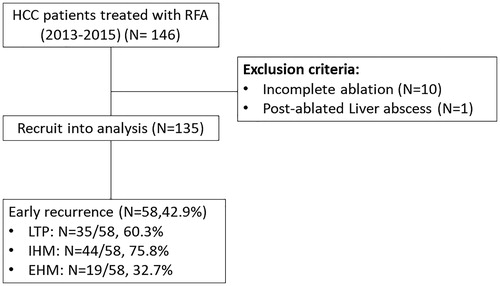
Table 1. Comparisons of baseline features of the patients with prolonged post-ablation fever (PAF) and others.
Table 2. Logistic regression for predictors of prolonged post-ablation fever.
Figure 2. Kaplan–Meier curve showing cumulative recurrence rate for all patients. Of all the 135 patients, prolonged PAF had higher 1-year tumor recurrence rate comparing to those without prolonged PAF (median time-to-recurrence interval: 19.6 vs. 40.5 months, 1-year cumulative tumor recurrence rate: 72.7% vs. 37.1%, Log rank test, p = 0.002).
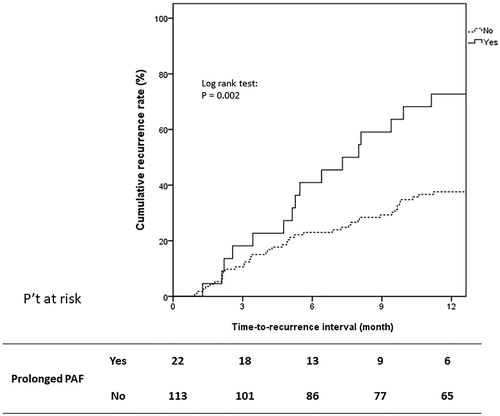
Table 3. Comparisons of baseline features of the patients with early recurrence and nonrecurrence.
Table 4. Cox’s proportional hazards model for predictors of progression free survival (PFS).
Figure 3. Kaplan–Meier curve showing cumulative recurrence rate for different TNM stages. (A) In TNM stage I (N = 103), the patients with prolonged PAF had a trend to have a higher early recurrence rate (prolonged PAF vs. without: 63.6% vs. 36.2%, Log rank p = 0.097). (B) As for TNM stage II (N = 32), patients with prolonged PAF had significantly higher early recurrence rate (prolonged PAF vs. without: 81.8% vs. 40.9%, Log rank p = 0.040).
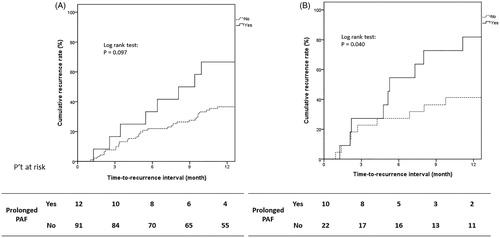
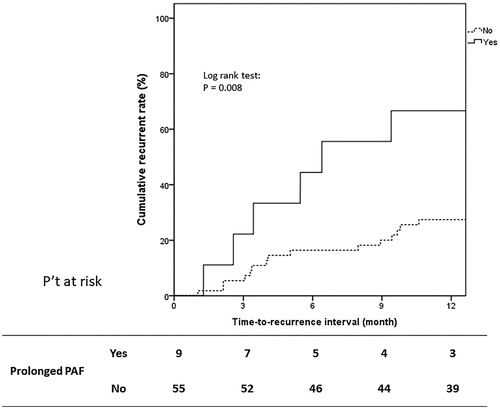
Figure 4. Kaplan–Meier curve showing cumulative recurrence rate for HCC treatment-naïve and single tumor patients. Of the subgroup of 64 patients with HCC treatment-naïve and single tumor, prolonged PAF had higher 1-year tumor recurrence rate comparing to those without prolonged PAF (median time-to-recurrence interval: 6.4 vs. 20.8 months, 1-year cumulative tumor recurrence rate: 66.6% vs. 27.2%, Log rank test, p = 0.008).