
Figures & data
Figure 1. Schematic of proposed patient workflow. Workflow designed to assess the potentially MRgHIFU-treatable percentage of a patient’s target tumor. Using a supine referral image dataset, step 1 involves segmentation of important structures: organs at risk, acoustic obstructions, and the target tumor. Step 2 rotates the referral imaging dataset into possible treatment positions, with the tumor centroid lying, by idealized design, along a vertical line through the magnetic isocentre and, by system design, the transducer’s home position. In step 3, target coverage (i.e. percentage of target volume coverable by an 8 mm treatment cell) is calculated. Cycling through steps 2 & 3 identifies the patient orientation with the maximum target volume coverage. In step 4, the treatable percentage of the target volume is quantified, using acoustic and thermal modeling of MRgHIFU treatment. This allows a clinical decision of whether to progress to treatment to be made.
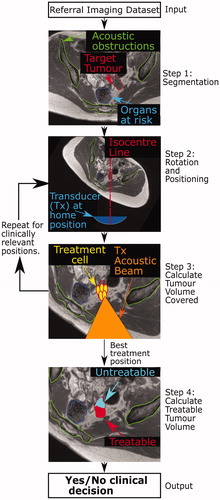
Figure 2. Schematic of developmental methodology used in this study. The accuracy of the methodology to calculate target coverage from referral imaging was assessed using this workflow. The target volume coverage by MRgHIFU was calculated from a subject’s treatment image dataset, acquired with the subject placed in a plausible or actual treatment position (bottom row) for volunteers or patients, respectively. Comparison with the target volume coverage predicted from a supine referral image datasetet allowed assessment of the methodology. Step 1: the referral imaging dataset is rotated into the same orientation as the treatment imaging dataset using affine registration both to allow comparison with the treatment imaging dataset. Step 2: segmentation of acoustic obstructions (e.g. bones, shown), organs at risk (patients only) and the target tumors (patients only) was performed to identify tissues that impede target coverage. Step 3: Target volume coverage was calculated for the registered-referral imaging dataset and the treatment imaging dataset, and finally, the two quantities were compared to assess the predictive capacity of the methodology.
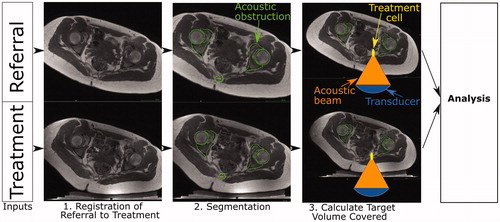
Table 1. Details of volunteers participating in this study.
Table 2: Details of patients participating in this study.
Figure 3. Schematic of the Sonalleve® V2 MRgHIFU system: LEFT - a subject lying on the MR bed will compress the acoustic-coupling gel-pad and bow the acoustic membrane, which seals the oil bath. Ideally, target tissue would be centered directly above the transducer’s home position and the center of the membrane/gel pad and below the magnetic isocentre. RIGHT- a coronal view of the MRgHIFU couch showing the transducer’s home position below the center of the membrane.
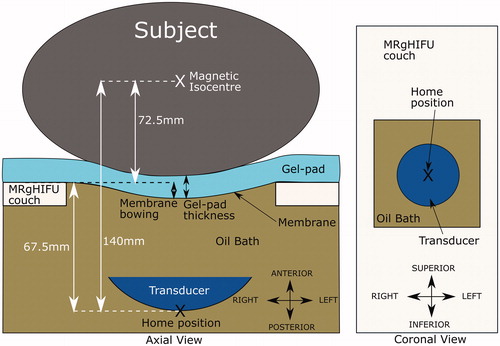
Figure 4. Transducer translation restrictions for volunteer data. Practical restrictions applied to the transducer’s translation capabilities (solid red lines) for volunteer datasets only. (a) For a treatment imaging dataset, the left-right translation was limited by the extent of acoustic coupling between the volunteer’s skin and the gel pad. The corresponding registered-referral imaging dataset shared these left-right restrictions. (b) For a registered-referral imaging dataset, the transducer’s inferiorsuperior translation was restricted by the extent of pelvic bone and the requirement for a full body outline within the image. The corresponding treatment imaging dataset shared these inferior-superior restrictions.
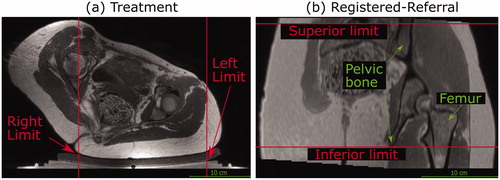
Figure 5. Method used to predict the transducer’s anterior-posterior home position in a registered-referral imaging dataset. The treatment dataset magnetic isocentre is known because the registered-referral imaging dataset had been registered to the treatment imaging dataset. A line was drawn downwards from the treatment dataset isocentre and intersected the skin at the skin point. From this skin point, the home position was calculated using the average compressed gel-pad thickness, the average membrane bowing distance, and the calibrated distance between undeformed membrane and home position of 67.5 mm (see ).
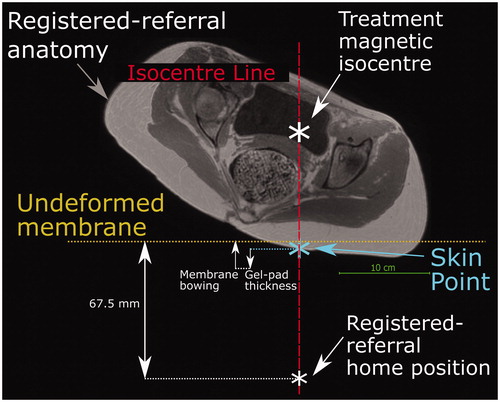
Figure 6. Method for quantifying target volume covered within a dataset (volunteer treatment imaging dataset in this example). A regular 3D grid of potentially accessible points was created (blue crosses) within the target: soft tissue (volunteers) or tumor (patients). For each transducer position and tilt identified in Section 2.5.3, the acoustic beam was checked for intersection with any acoustic obstructions (green contours) or organs at risk. If no obstruction exists, an 8 mm treatment cell was created around the focus (yellow ellipse). Grid points within a treatment cell were marked as ‘covered' (red crosses).
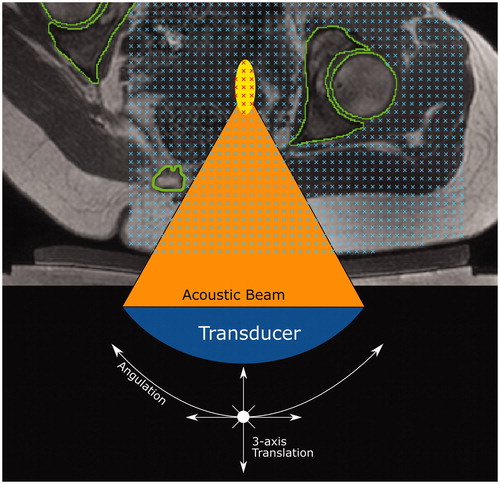
Figure 7. Percentage of target volume covered. (a) For volunteers, the agreement between the referral and treatment covered volumes is shown, where the treatment covered volume is the ground-truth. (b) For patients, the percentage of the registeredreferral tumor (red) and the treatment tumor (blue) that was covered is shown. The numbers on top of each set of bars represent the difference in % Tumor Volume Covered predicted from the registered-referral dataset, and that calculated from treatment dataset. Representative examples of target coverage for volunteers (c) and tumor coverage for patients (d) are shown, with a scale bar in (d). The anatomy is shaded purple in the registered-referral dataset, and green in the treatment dataset.

Data availability statement
The data that support the findings of this study are not available due to limitations in the ethical review.