Figures & data
Figure 1. Flow chart of study participants.
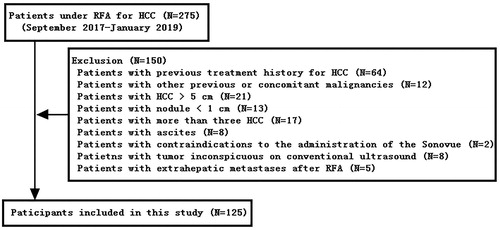
Table 1. Characteristics of patients and HCC lesions.
Table 2. Potential risk factors affecting HCC recurrence after RFA.
Figure 2. ROC for PI measured by CEUS. The areas under the curve were 0.72 with a 95%CI for the area between 0.63 and 0.81.
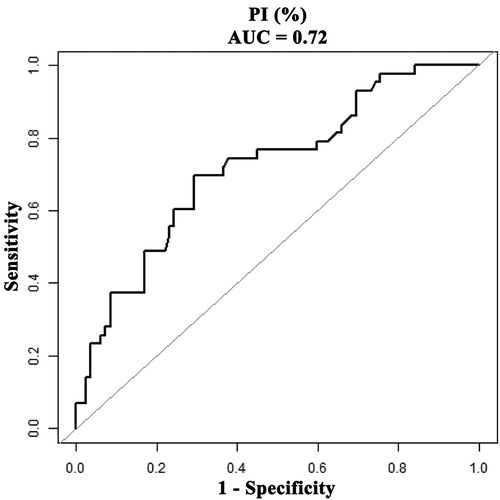
Figure 3. Recurrence-free survival (RFS) of HCC patients according to different levels of PI. Patients with a PI 58.8% or lower had significantly poorer RFS than those with higher. (p < 0.0001).
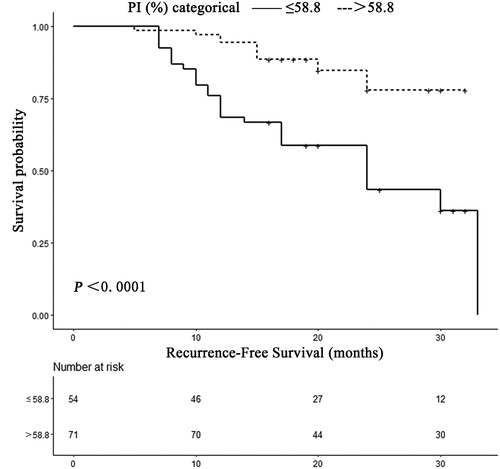
Figure 4. The association between tumor size and risk for HCC Recurrence.
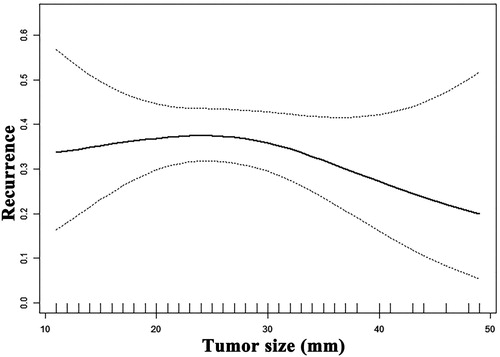
Table 3. Relationship between TTP and HCC recurrence after RFA in subgroup of tumor size.
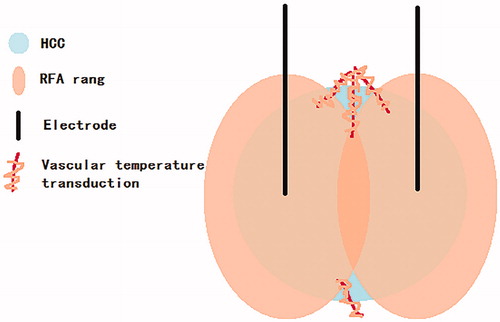
Figure 5. The hypothesis of overlapping ablation temperature conduction along the vessel to the residual tumor.