Figures & data
Table 1. Patients, underlying diseases and ablation histories.
Table 2. Statistical summary of patients and interventions included in this study.
Figure 1. A 9-year-old patient with (A) recurrent HB (margin, arrowhead). Planning-CT immediately before SRFA showing hypervascular lesion with 6 cm in diameter. (B) CT image immediately after SRFA showing complete necrosis. A 5-month-old patient with (C) a highly differentiated HCC 3 cm in diameter (CT image, black arrows). Adjacent organs are highlighted (D duodenum, P pancreas). (D) Skin fiducials are attached to the patient and prepared for the intervention. (E) Multiple probe trajectories (colored lines) are defined by using multiplanar and 3D reconstructed images before the ablation procedure. (F) CT image of the tumor after ablation.
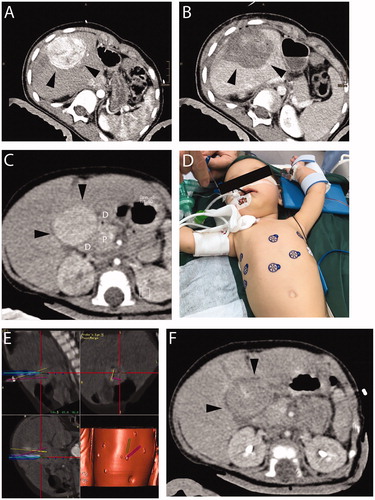
Figure 2. A 15-year-old patient with hepatic subcapsular cyst (Echinococcus multilocularis). (A) A 5.2 × 4.4 cm E. multilocularis lesion (white arrow). (B) Multiple probe trajectories (colored lines) are defined by using multiplanar and 3D reconstructed images before the ablation procedure. (C) SRFA electrodes are sequentially introduced into the coaxial needles. (D) MRI image 3 months after SRFA (white arrowhead) depicts scar tissue without evidence of cystic lesions.
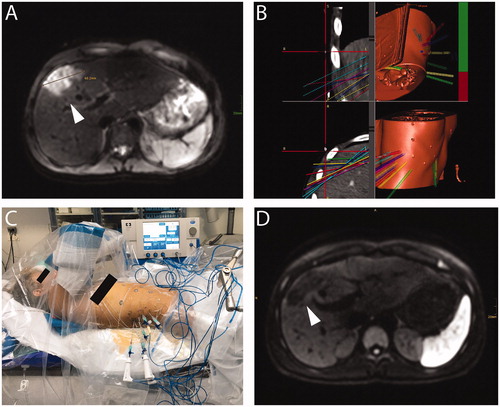
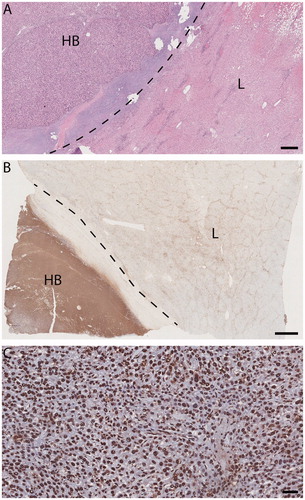
Figure 3. Light micrographs, explanted liver (patient 1) with SRFA-treated HB. (A) and (B) HB (HB hepatoblastoma, L adjacent liver). Dotted line, tumor pseudocapsule. A viable-appearing tumor and background liver. Hematoxylin/eosin, size bar, 500 µm. (B) Immunohistochemical evidence of response to injury much more pronounced in tumor than in background liver. TUNEL staining size bar, 2 mm. (C) HB: tumor-cell, endothelial and fibrocyte nuclei alike are marked TUNEL positive, indicating apoptosis in both tumor and stroma. TUNEL staining size bar, 50 µm.