Figures & data
Figure 1. Characteristic findings of hepatocellular carcinoma (HCC) in a hepatobiliary phase (HBP) image using gadolinium-ethoxybenzyl-diethylenetriamine pentaacetic acid magnetic resonance imaging (EOB-MRI). (a) Fusion imaging combining a grayscale ultrasound (left side) and HBP image of EOB-MRI (right side). In the transverse HBP image, the HCC lesion has local irregular protruding margins, which seem to be budding portions at the periphery of the lesions. (b) Fusion imaging combining a grayscale ultrasound (left side) and HBP image of EOB-MRI (right side). HCC lesions with the appearance of peritumoral hypointensity in the HBP image, which show as a hypointense area of hepatic parenchyma located outside of the tumor margin. They usually appear in the plane where the lesion is not at the maximum diameter, and in various shapes, such as wedge-shaped or flame-like. We can see that the ultrasound image may not clearly show the hypointense area, while HBP images do. The arrows and arrowheads shown in all the images indicate the HBP findings and the border of the lesions, respectively. These lesions are not adjacent to the portal vein or hepatic vein. Lesion size and segmental location are recorded as follows: (a) S3, 22×20 mm; (b) S4, 15×13 mm.
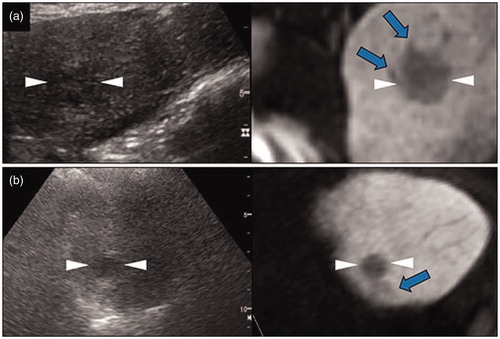
Figure 2. The local tumor progression (LTP) of a HCC lesion after radiofrequency ablation (RFA). (a) A hepatobiliary phase image of EOB-MRI shows the peritumoral hypointensity appearance (arrow). (b, c) Contrast enhanced ultrasound examination using a Sonazoid agent. The arterial phase image (b) exhibits a washed in appearance, while the post-vascular phase image (c) shows a washed out appearance. (d) Pre-operative fusion imaging combining a grayscale ultrasound (left side) and the hepatobiliary phase image of EOB-MRI as a reference (right side) on a single screen. Arrowheads in (a–d) indicate the margin of the lesion. (e) The grayscale ultrasound image shows the ablated area (arrowheads). (f) Portal phase of the contrast-enhanced CT image obtained four months after RFA shows the ablate area (arrowheads) and adjacent low density area (arrow), which suggests LTP. This lesion is from a 78 year-old male patient and was pathologically confirmed as poorly differentiated HCC (maximum diameter 23 mm) in segment VII.
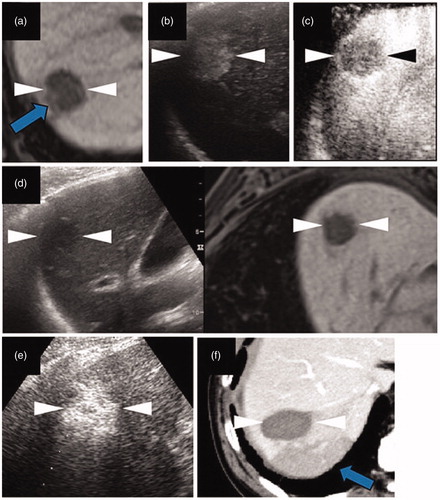
Figure 3. Intrahepatic distant recurrence (IDR) of a HCC lesion after radiofrequency ablation (RFA). (a–c) Axial T1-weighted image on a plain scan, the arterial phase, and the hepatobiliary phase (HBP) of EOB-MRI, respectively. The lesion is 27 mm in segment VI/VII. Arrows (a–c) indicate the local irregular protruding margins. (d, e) Contrast enhanced ultrasound examination using a Sonazoid agent. The arterial phase image (d) exhibits a washed in appearance, while the post-vascular phase image (e) shows a distinct washed out appearance. (f) An HBP image of EOB-MRI obtained 3 months after RFA shows adequate necrosis (arrowheads). (g) Fusion imaging combining a grayscale ultrasound (left side) and contrast-enhanced CT image (right side) on a single screen, showing an IDR lesion at the half-year follow-up examination. Both the grayscale ultrasound and contrast-enhanced CT images show an IDR lesion of about 13 mm in size in segment VII. Arrowheads (a–e) and (g) indicate the margin of the original lesion and IDR lesion, respectively. This case comes from a 76 year-old female patient with chronic C hepatitis. The original lesion and the IDR lesion were pathologically confirmed to be poorly and moderately differentiated HCCs, respectively.
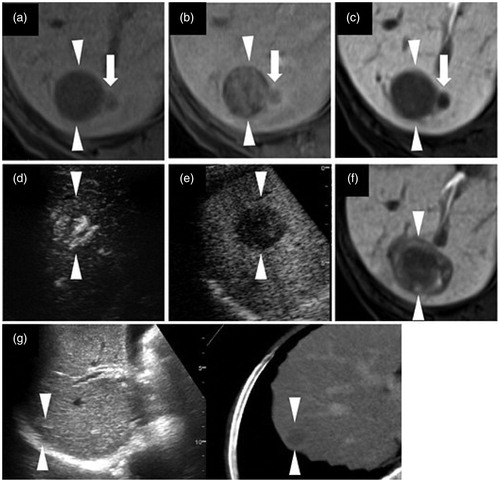
Table 1. Baseline characteristics of patients and HCC lesions.
Table 2. The impact of HBP findings and methods of guiding RFA on the type of recurrence.
Table 3. The impact of the HBP findings of HCC and method of guiding RFA on recurrence.
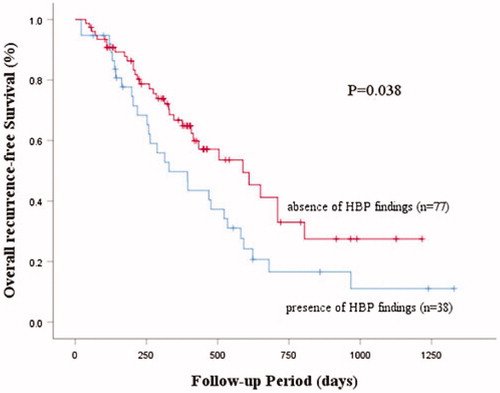
Figure 4. Overall recurrence-free survival curves according to categorization by absence and presence of HBP findings. A significant difference in the overall recurrence rate was evident between groups with and without HBP findings (p = 0.038).