Figures & data
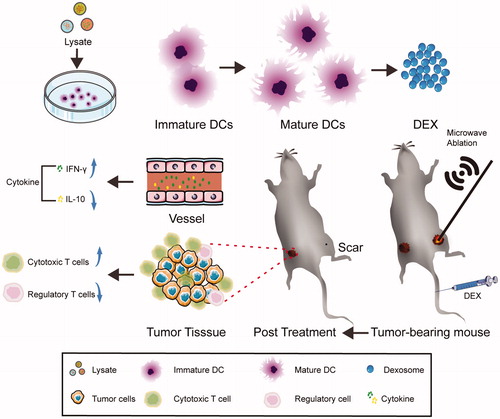
Figure 1. Analysis of the expression of surface proteins on DCPBS or DCLYS by flow cytometry.
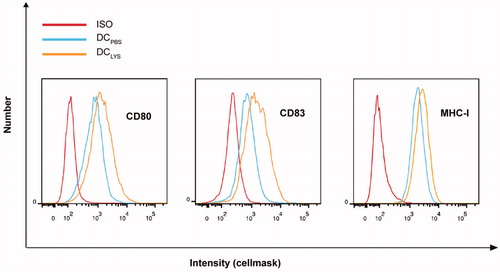
Figure 2. Exosome characterization. (A) The size distribution of Dex was analyzed by NS300 Nanoparticle Analyzer. (B) The morphology of Dex was observed by transmission electron microscope. (C) The surface makers of Dex were detected by Western blot. A total of 12 μg protein was loaded for all lanes.
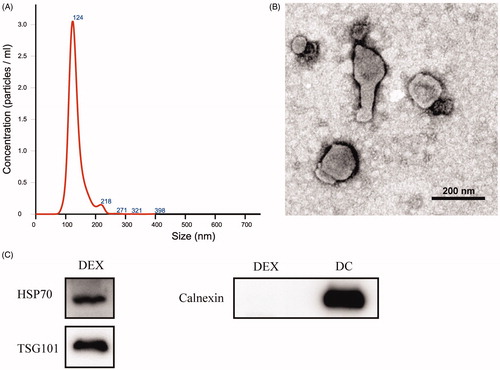
Figure 3. The killing effect of Dex- or mDC-induced cytotoxic T lymphocytes (CTL) to hepa1-6 cells in vitro. An LDH-releasing assay was performed to detect cytotoxicity induced by Dex (A) or mDC (B). ***p<.001.
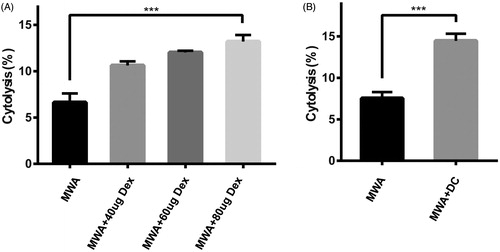
Figure 4. The treatment effect of MWA combined with Dex or mDC in murine hepa1-6 subcutaneous tumor models. (A) Time schedule outlines for the treatments in this study; 80 μg or 1 × 10⁶ mDC were injected into the tail vein of the mice (Day 0, Day 3) after MWA; the unablation side tumor was monitored for 12 days. (B) The ablation side tumor was replaced by a small scar (Day 9). (C, D) Tumor volume was monitored and compared among three groups: (1) MWA, (2) MWA + DC, (3), and MWA + Dex. ***p<.001; NS: not significant (n = 18, six mice were used per group).
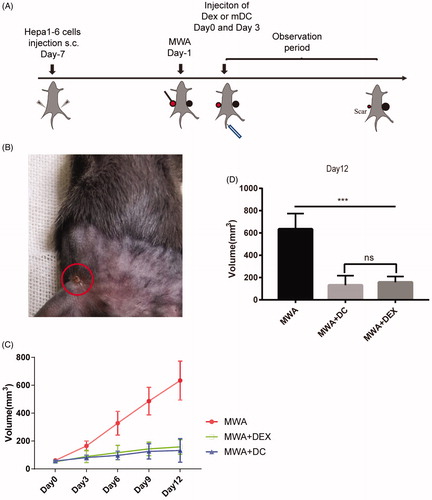
Figure 5. Evaluation of the immune milieu in mice. (A, B, C, D) On Day 12, splenocytes were stained with anti-CD3, anti-CD8, anti-CD4, anti-CD25, and anti-FoxP3 antibodies and analyzed by flow cytometry. Six mice were used in each group. (E, F, G, H) The number CD8+ and FoxP3+ cells in untreated tumors were counted in five randomly chosen areas at 400-fold magnification. Five mice were used in each group. ***p<.001; **p<.01; NS: not significant.
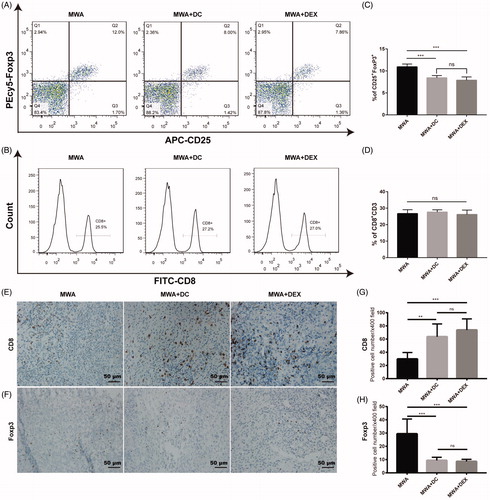
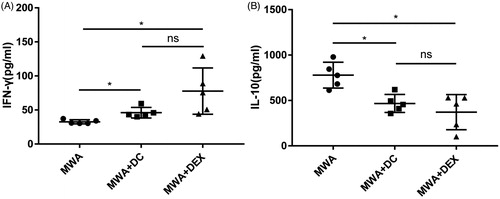
Figure 6. Measurement of IFN- γ (A) and IL-10 (B) in plasma of mice by ELISA. Five mice were used in each group. *p<.05; NS: not significant.