Figures & data
Figure 1. The position and orientation of the laser applicator on transrectal ultrasound images (A, transverse section; B, longitudinal section). The distances from the tip of the laser applicator to prostatic capsule (a, d), the outer wall of the urethra (b), the rectum wall (e), and the bladder floor (c).
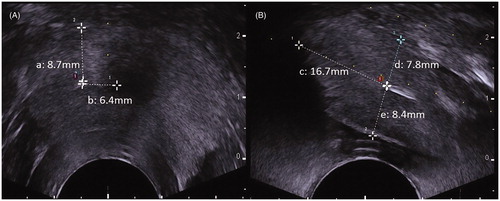
Figure 2. The prostate gland and laser-ablated lesions in beagles prostate were evaluated by TRUS Images (A, B, C, D) and TR-CEUS images (a, b, c, d) before and after TPLA. TPLA: transperineal laser ablation.
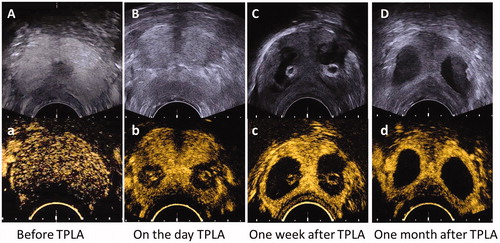
Table 1. Volumes of the prostate gland and laser-ablated lesions before and after TPLA in beagles.
Figure 3. The pathological images of beagle prostate were captured 1 day after TPLA (3 W/600J). (A) A photo of the formalin-fixed specimen showing a coagulated/necrotic lesion. (B) A microscopic photo of the prostate with HE staining demonstrating three zones of the laser-ablated lesion, i.e. the coagulative zone (CZ), the marginal zone (MZ), and the untreated normal zone (UZ), under low magnification (10 ×). Note that B1 and B2 are photos of CZ and MZ observed under high magnification (200 ×). TPLA: transperineal laser ablation.
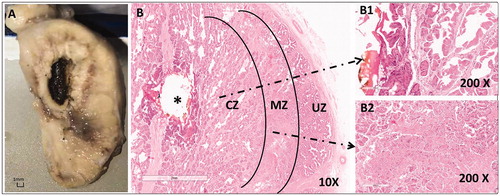
Figure 4. The microscopic images of HE staining of beagle prostate one week after TPLA (3 W/600J). (A) A low magnification (10 ×) view of the prostate showed three zones (CZ, MZ, UZ) of the ablated lesion. A1–A4: A high magnification (200 ×) view from A demonstrated the structure of each zone in details. CZ: coagulative zone; MZ: marginal zone; TPLA: transperineal laser ablation; UZ: untreated zone.
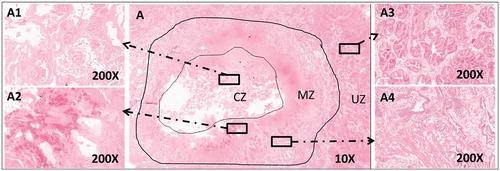
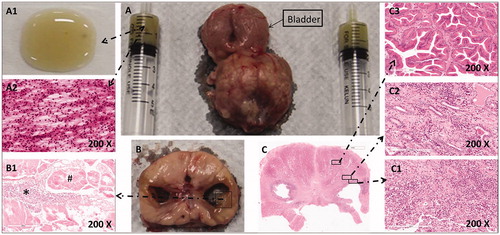
Figure 5. The pathological images of a beagle prostate were captured 1 month after TPLA (left 3w/600J, right 3w/1200J). (A) A prostate specimen with urinary bladder and fluid aspirated from the cavity of the ablated lesion. A1. The liquid appeared yellowish and sticky on the glass slide. (A2) The HE staining image of the liquid under high magnification (200 ×) showed unstructured necrotic debris and inflammatory cells. (B) A cross-sectional view of the prostate gland with an ablated lesion on each lobe. (B1) The HE staining image of the cavity wall showed necrotic tissues (#) and inflammatory cells (*) without a definite structure. (C) The HE staining image of a prostate section under low magnification (10 ×). C1. Inflammatory cells were seen on the wall of the cavity under high magnification (200 ×). C2. Inflammatory cells and normal prostate gland were seen in the MZ. C3. Normal prostate gland structures were seen in the NZ under high magnification (200 ×).