
Figures & data
Figure 1. In vivo data. (a) The time history of the contrast in the aorta illustrates the bolus of contrast arrival time. The different lines illustrate three representative pixels. (b) The labeled regions illustrate the imaging visible vessels (red), the tumor (blue), and the liver parenchyma tissue (green). Pixelwise distance from the nearest vessel boundary provides the spatial length scale for our governing hyperbolic equation for convective transport.
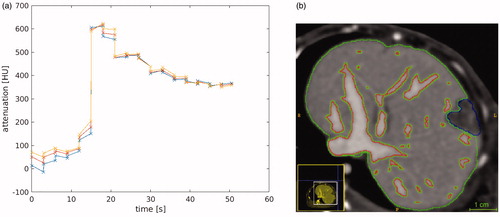
Figure 2. Domain decomposition of liver anatomy with simple linear iterative clustering (SLIC) segmentation. An (a) axial view and (b) 3 D visualization of the domain decomposition is shown.
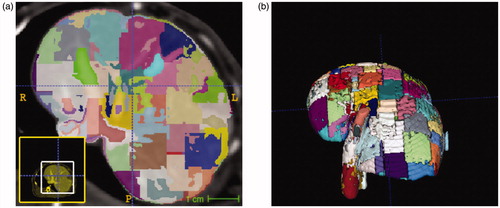
Figure 3. An overview of our algorithmic approach is shown for animal id1. (a) The extended Tofts model provides a control for the proposed approach. Spatial variations in the tissue fractional plasma volume parameter fpv within the parenchyma and vessels is shown. Negative values are the result of the curve fit of the analytical model in EquationEquation (13)(13)
(13) to the time-intensity data at each pixel. (b) Spatial variations in the bolus arrival time is measured in seconds. (c) Distance information is computed with respected to imaging visible vessels. An example of the 3 D vessel segmentation used to calculate the signed distance transform
is shown. (d) The bolus arrival time combined with the distance information provide estimates of the flow speed. Correlation between the super pixel recovered speed and the average of the pixelwise is shown. Within these pixels the average speed represented by the super pixel is expected to provide dimension reduction of the parameter optimization space while maintaining accuracy of the solution field.
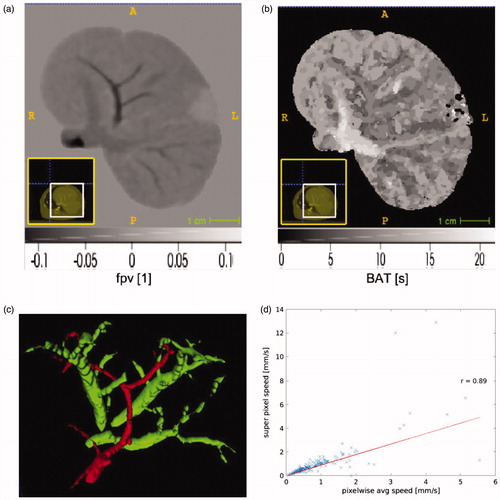
Figure 4. Tofts model, fpv, versus flow speed estimates are provided. The fractional plasma volume is a dimensionless parameter. Animal id1, id2, id3, and id4 are shown in (a), (b), (c), and (d); respectively. The correlation, r, between the fractional plasma volume and flow speed is provided within each dataset.
![Figure 4. Tofts model, fpv, versus flow speed estimates are provided. The fractional plasma volume is a dimensionless [1] parameter. Animal id1, id2, id3, and id4 are shown in (a), (b), (c), and (d); respectively. The correlation, r, between the fractional plasma volume and flow speed is provided within each dataset.](/cms/asset/b1cf0066-53d8-41c4-a056-91bd366275b9/ihyt_a_1845403_f0004_c.jpg)
Table 1. Summary of extended Tofts analysis.
Table 2. Summary of permeability measurements.