Figures & data
Figure 1. Characteristics of the patients and the fibroids enrolled in this study.
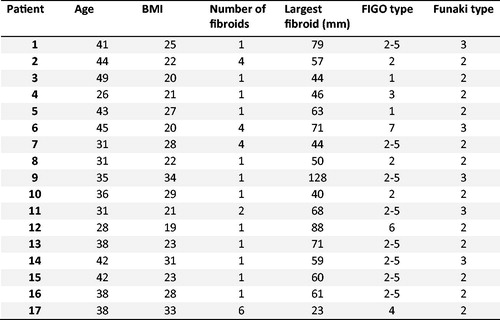
Table 1. MR imaging parameters.
Figure 2. T2 weighted MR images of a uterine fibroid in (a) axial and (b) sagittal plane. Quantitative blood flow maps of the same fibroid in axial plane (c) without oxytocin and (d) with oxytocin. Contrast enhanced T1 weighted MR images of the same fibroid in axial plane (e) without oxytocin and (f) with oxytocin.
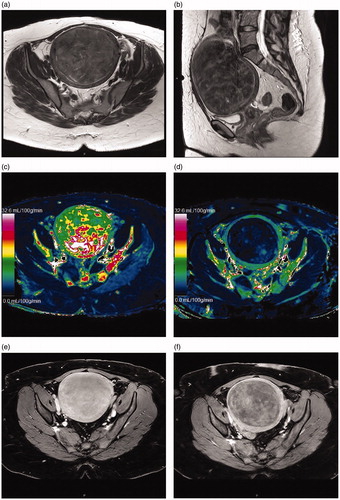
Figure 3. (a) Blood flow of the largest fibroid of every patient without oxytocin and with oxytocin (b) The median blood flow of all fibroids without oxytocin and with oxytocin, *p-value < 0.0001.
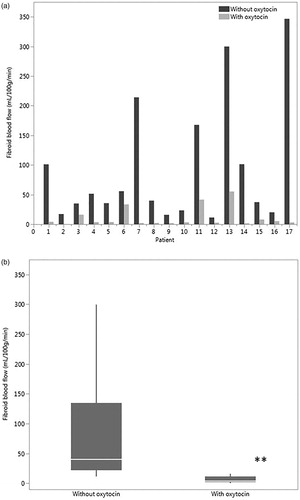
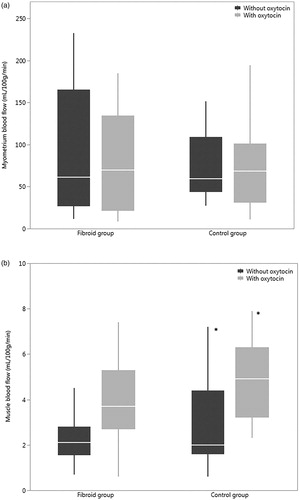
Figure 4. (a) Blood flow of the myometrium without oxytocin and with oxytocin in the fibroid patients and the control group (b) Blood flow of the skeletal muscle without oxytocin and with oxytocin in both groups, *p < 0.05.