Figures & data
Figure 1. Tumor volume measurement. Tumor volumes measured before the RFA procedure are not different between the three groups (p = 0.78, one-way ANOVA).
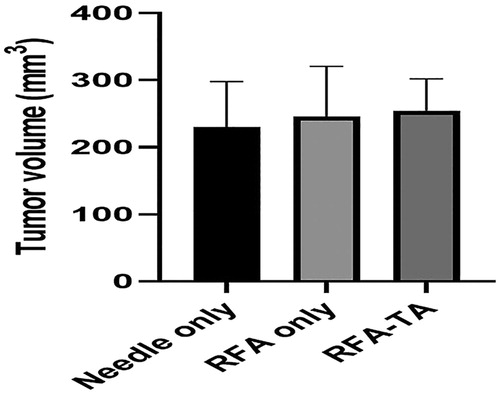
Figure 2. Bioluminescence imaging of the tumors. (A) Bioluminescence images of tumors acquired before and after the RFA procedures. (B) Relative BLI values of tumors measured before and after the RFA procedures. Relative BLI values of the RFA only group and RFA-TA group decrease significantly compared to the needle only group after the RFA procedure (**p < 0.01 for needle only vs. RFA only, ***p < 0.001 for needle only vs. RFA-TA, post-hoc analyses of one-way ANOVA).
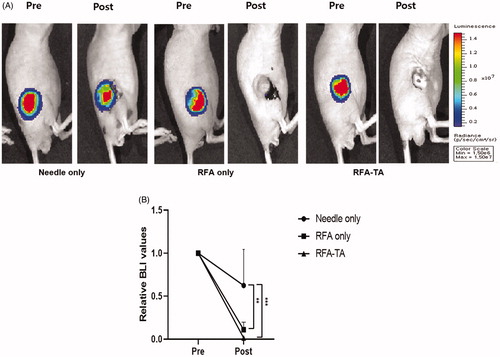
Figure 3. Bioluminescence imaging of the needles. (A) Bioluminescence images of the needle tips acquired after the RFA procedures. (B) BLI values of the needle tips are significantly different between three groups (**p < 0.01 for needle only vs. RFA only, ***p < 0.001 for RFA only vs. RFA-TA, post-hoc analyses of one-way ANOVA).
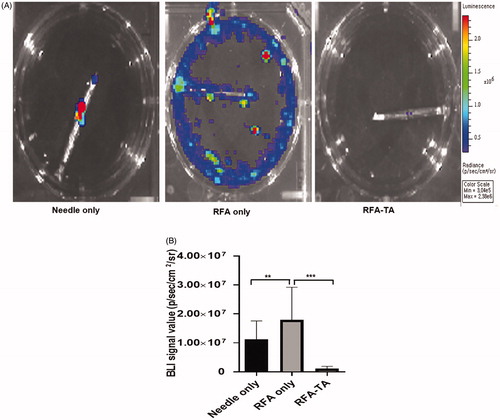
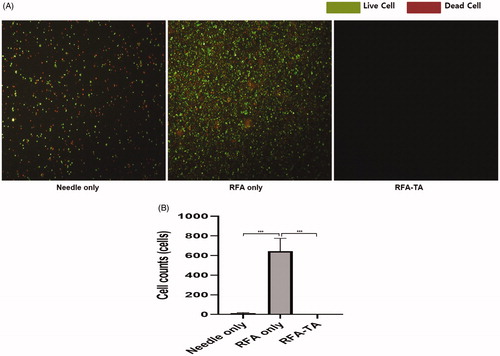
Figure 4. Live cell counting. (A) The acridine orange stains live cells with a green color, and the propidium iodide staining stains dead cells with a red color. The live cells are abundant in the RFA only group, but are rarely seen in the RFA-TA group (acridine orange/propididum iodine stain, ×10). (B) The average number of live cells in the RFA-TA group is significantly lower than that of RFA only group (***p < 0.001) and needle only group (***p < 0.001), respectively (Post-hoc analyses of one-way ANOVA).