Figures & data
Figure 1. Flowchart of the study.
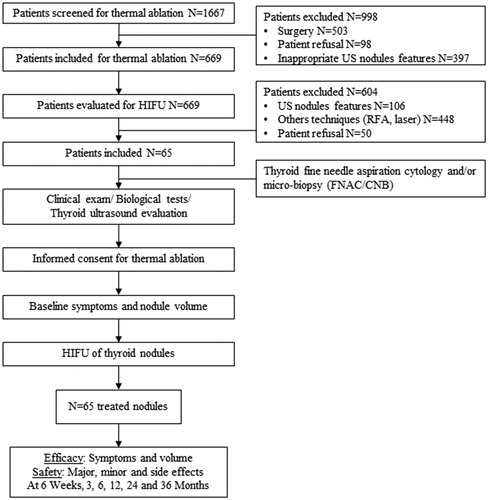
Table 1. Description of patients’ and nodules’ characteristics.
Table 2. HIFU ablation parameters.
Figure 2. Nodule volume reduction from baseline. In brackets (): number of patients at each time of follow-up.
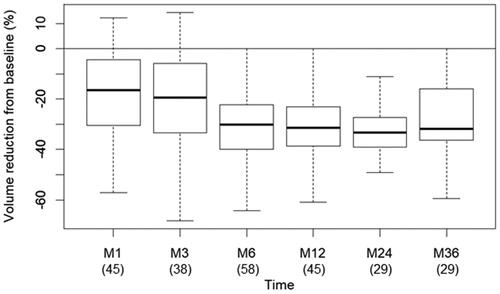
Table 3. Evaluation of volume reduction at each time of follow-up.
Table 4. Evaluation of the safety of the HIFU ablation.
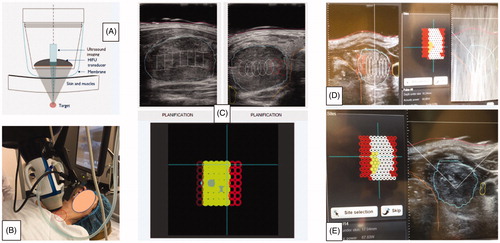
Figure 3. HIFU procedure. (A) Diagram of the active head: focalization of ultrasound on a target zone guided by ultrasound imaging. (B) The treatment head is positioned in contact with the skin in front of the nodule. A laser beam (red circle) detects any movement of the patient and can stop the procedure (repositioning of the system). (C) Planning. The operator draws on the screen, the boundaries of the nodule, the skin the trachea and the carotid artery. The computer-controlled device will treat the target tissue, while preserving the surrounding tissues. (D) Software screen during treatment: on the left: Concentrated Interference Pattern. (E) Hyperechoic marks (whitish spots) correspond to a treated area.