Figures & data
Table 1. Primers pairs used in this study, purchased from Qiagen.
Figure 1. Effects of Meth and NE on ROS production in BA and macrophages. (A) H2O2 was measured in the supernatant of BA primary cultures 30 min and 24 h following exposure with 0.1 µM NE, 60 µM Meth, and/or 5 pg/ml N-acetyl D-cysteine (NAC), and/or 2 U/ml of Catalase (Cat). (B) H2O2 was measured in macrophage culture supernatants 30 min and 24 h following exposure with NE, and/or Meth, with or without NAC or Cat. (C) Superoxide (O2−) detection was performed in BA cell cultures by staining with DHE. Representative images show a comparison of DHE intensity and pattern between BA and macrophages in culture, 30 min after exposure with NE or Meth, with or without NAC. (D) Normalized DHE fluorescence intensity, performed in Fiji/ImageJ. Two-way ANOVA was followed by Bonferroni’s post hoc test. *p < 0.05 in comparison to controls in each time point. # p < 0.05 in comparison to Meth group.
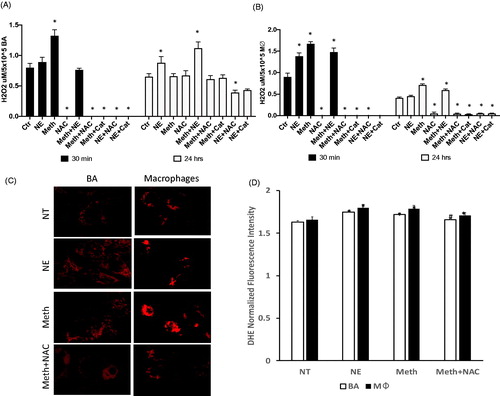
Figure 2. Changes in mitochondrial membrane potential induced by Meth and NE in BA and macrophages. JC1 was measured as the ratio between monomers and aggregates (A) in BA cultures, and (B) in macrophages, 24 h after treatment with vehicle, Meth, NE, with or without NAC. H2O2 was added as a control. ANOVA followed by Bonferroni’s post hoc test. *p < 0.05, indicates significant comparisons against vehicle-treated control cultures.
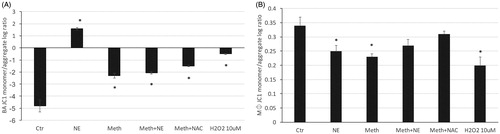
Figure 3. Oxygen consumption rate (OCR) in Meth and NE stimulation in BA and macrophages. OCR was recorded as an average of 3–4 wells containing 105 cells. Media, Oligomycin (Oligo), FCCP, Rotenone and Antimycin A (RAA) were added as indicated. (A) BA and (B) Peritoneal macrophages were stimulated with 0.1 µM NE, 60 µM Meth or both. The contribution of ROS to the effects of Meth was examined by the addition of 5 pg/ml NAC, simultaneously with Meth. Bar graphs show the total OCR during basal, Oligomycin and FCCP stimulation in (C) BA and (D) macrophages. The experiment was replicated 3 times. *p < 0.05, ANOVA followed by Bonferroni’s test.
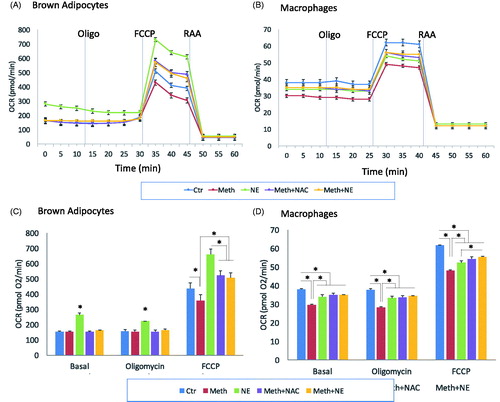
Figure 4. Oxidative stress gene expression in macrophages stimulated with Meth and NE in culture. Macrophages isolated from BAT were stimulated for 24 h with (A) Meth (60 µM) or (B) NE (0.1 µM), and the transcription of genes associated with oxidative stress was measured in targeted PCR arrays, with normalization performed using GAPDH and 18S. The functional interactions between the measured genes were visualized using Cytoscape, where blue shades in nodes represent downregulation, and red represents upregulation, when compared to unstimulated controls. Square nodes represent significance at p < 0.05 in each assigned comparison. (C) The transcriptional levels of superoxide dismutases 1, 2, and 3 (SOD1, SOD2 and SOD3), can be appreciated in isolation. Two-way ANOVA was followed by Bonferroni’s post hoc test. *p < 0.05 in comparison to the control group.
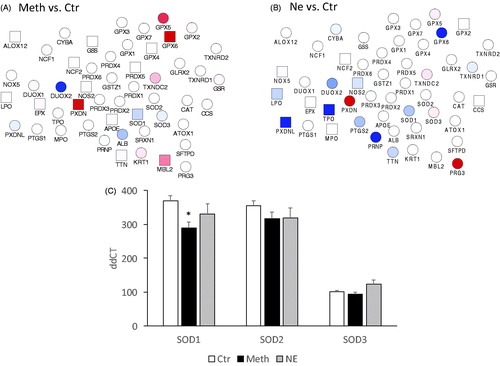
Figure 5. Phenotypes of macrophages isolated from BAT after vehicle or Meth injection. Macrophages were isolated from BAT 24 h after in vivo treatment with vehicle or 3 mg/kg of Meth ip. (A) The transcription of genes associated with oxidative stress was measured in targeted PCR arrays, with normalization performed using GAPDH and 18S. The functional interactions between the measured genes were visualized using Cytoscape, where blue shades in nodes represent downregulation, and red shades represent upregulation when compared to macrophages from vehicle-injected animals. Square nodes represent significance at p < 0.05 in each assigned comparison. Changes suggest similarities with patterns produced in vitro by NE treatment. (C) Transcriptional expression of genes that indicate macrophage subsets M1 (iNOS, IL6) and M2 (Arg1, Mrc1, CD163 and Stat6). (D) Transcriptional expression of IL4 and IL13 in BAT. These cytokines can increase and signal M2 macrophages to control thermogenic commitment in adipocytes [Citation36]. The transcriptional changes were performed 24 h after treatment and were examined by SyBrGreen qRT-PCR. Relative values were normalized based on GAPDH. Values represent the average ± SD of four replicates/group. *p < 0.05 Compared to respective controls.
![Figure 5. Phenotypes of macrophages isolated from BAT after vehicle or Meth injection. Macrophages were isolated from BAT 24 h after in vivo treatment with vehicle or 3 mg/kg of Meth ip. (A) The transcription of genes associated with oxidative stress was measured in targeted PCR arrays, with normalization performed using GAPDH and 18S. The functional interactions between the measured genes were visualized using Cytoscape, where blue shades in nodes represent downregulation, and red shades represent upregulation when compared to macrophages from vehicle-injected animals. Square nodes represent significance at p < 0.05 in each assigned comparison. Changes suggest similarities with patterns produced in vitro by NE treatment. (C) Transcriptional expression of genes that indicate macrophage subsets M1 (iNOS, IL6) and M2 (Arg1, Mrc1, CD163 and Stat6). (D) Transcriptional expression of IL4 and IL13 in BAT. These cytokines can increase and signal M2 macrophages to control thermogenic commitment in adipocytes [Citation36]. The transcriptional changes were performed 24 h after treatment and were examined by SyBrGreen qRT-PCR. Relative values were normalized based on GAPDH. Values represent the average ± SD of four replicates/group. *p < 0.05 Compared to respective controls.](/cms/asset/0725331b-f11a-481b-84f6-e05076c12755/ihyt_a_1849822_f0005_c.jpg)
Figure 6. Effect of Meth and NE, and contribution of ROS, on the expression of genes associated with and regulating thermogenesis in BA. Transcriptional levels of (A) UCP1, (B) PPARγ, (C) PGC1α, (D) GADD45α, (E) GADD45β and (F) GADD45γ were measured in primary cultures at 24 h after stimulation with 0.1 µM NE, 60 µM Meth or both, 5 pg/ml NAC, or 2 U/ml of Catalase (Cat) using SyBrGreen qRT-PCR. Relative values were normalized based on GAPDH. Values represent the average ± SD of 8 technical replicates/group in four experiments. *p < 0.05 compared to respective controls.
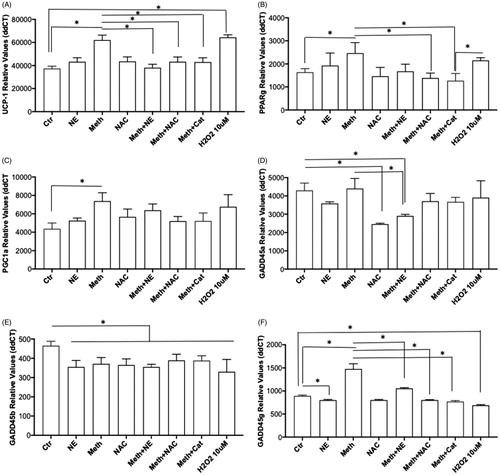
Figure 7. Effect of Meth and NE, and contribution of ROS, on the expression of signaling components of the ERR gene family in BA primary cultures. Transcriptional levels of (A) ERRα, (B) ERRβ, and (C) ERRγ were measured at 24 h after stimulation with 0.1 µM NE, 60 µM Meth or both, 5 pg/ml NAC, or 2 U/ml of Cat. using SyBrGreen qRT-PCR. Relative values were normalized based on GAPDH. Values represent the average ± SD of 8 technical replicates/groups in four experiments. *p < 0.05 compared to respective controls.
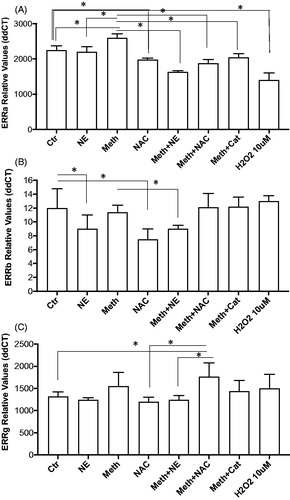
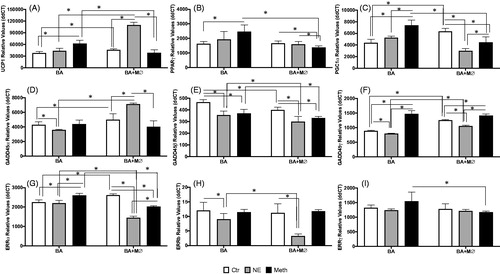
Figure 8. Effects of macrophages co-cultured with BA on transcriptional levels of thermogenic genes, after stimulation with Meth or NE. Transcriptional levels of (A) UCP1, (B) PPARγ, (C) PGC1α, (D) GADD45α, (E) GADD45β, (F) GADD45γ, (G) ERRα, (H) ERRβ and (I) ERRγ were measured at 24 h after stimulation with 0.1 µM NE, or 60 µM Meth by SyBrGreen qRT-PCR. Relative values were normalized based on GAPDH. Values represent the average ± SD of 6–12 technical replicates/groups in four independent experiments. *p < 0.05 in indicated comparisons.