
Figures & data
Figure 1. Flow diagram of patient selection for the study. HCC: hepatocellular carcinoma; RFA: radiofrequency ablation.
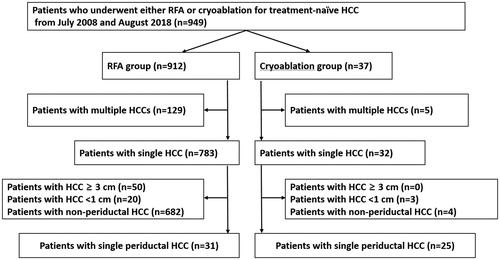
Table 1. Demographic and clinical characteristics of study patients.
Figure 2. A 76-year-old woman with autoimmune hepatitis. (A) Hepatobiliary phase magnetic resonance image shows a 1-cm HCC (arrow) abutting the right bile duct in segment 7. The bile duct is visualized as a tubular structure with high-signal intensity (arrowheads) because of contrast excretion. The tumor is also close to the right main portal vein (anterior side) and right hepatic vein (posterior side). (B) Portal-phase CT scan obtained immediately after cryoablation show an oval-shaped ablation zone covering the entire tumor; the ablation zone size is small because a single cryoprobe was used. There is no bile duct dilatation, suggesting the absence of severe bile duct damage. In addition, the adjacent portal vein and hepatic vein seem to be patent, and there is no perfusion abnormality in the liver. (C) Hepatobiliary phase magnetic resonance image obtained 4 months after the procedure shows the intact right bile duct. There is no upstream bile duct dilatation (not shown). No local tumor progression was noted during the 29-month follow-up period.
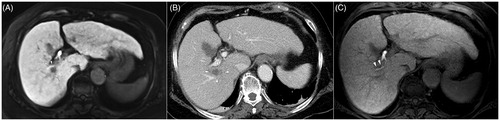
Figure 3. A 48-year-old man with liver cirrhosis due to chronic hepatitis B viral infection. (A) Hepatobiliary phase magnetic resonance image shows a 2.1-cm hepatocellular carcinoma (arrow) abutting the right anterior portal vein and right anterior bile duct (arrowheads) in segment 8. (B) Portal-phase computed tomography scan obtained immediately after radiofrequency ablation shows that the tumor is completely ablated with no immediate procedure-related complications. (C) Additional computed tomography (CT) scan obtained 4 days after the procedure because of high fever and abdominal pain. Portal-phase CT image shows air bubbles (arrowhead) in the radiofrequency ablation (RFA) zone and fat stranding in the perihepatic space near the RFA zone, indicating possible abscess and inflammation. The patient’s condition recovered after administration of empirical antibiotics.
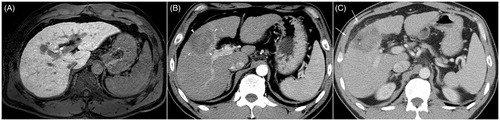
Table 2. Complications after treatment of hepatocellular carcinoma.
Table 3. Univariable and multivariable analyses of risk factors for biliary complications (biliary stricture, biloma, or abscess).
Figure 4. Cumulative local tumor progression rate of cryoablation and radiofrequency ablation. * Patients in the radiofrequency ablation group were censored to assess local tumor progression at 58 months based on the longest follow-up period for the cryoablation group.
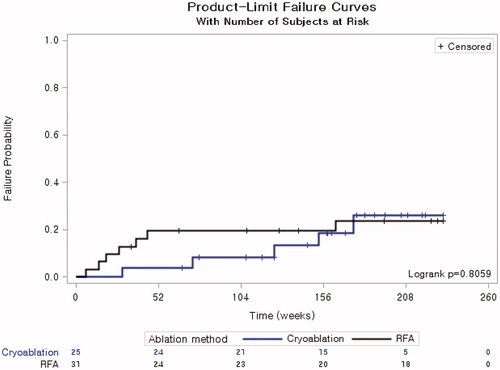
Table 4. Univariable and multivariable analyses of risk factors for local tumor progression.