
Figures & data
Figure 1. Patient selection. HCC: hepatocellular carcinoma; TACE: transcatheter arterial chemoembolization; RFA: radiofrequency ablation; WMA: wave microwave ablation.
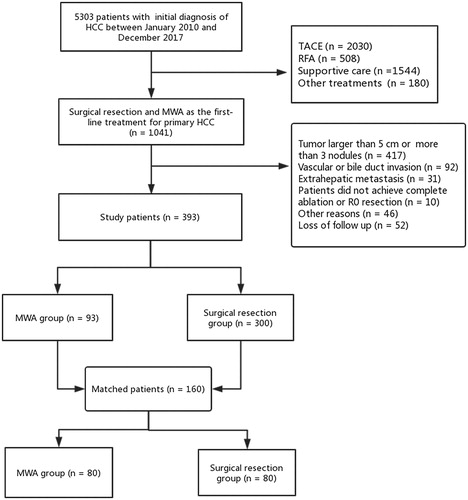
Table 1. baseline characteristics of the total cohort and PSM cohort for HCC up to 5 cm.
Figure 2. Overall survival and progression-free survival curves of patients with hepatocellular carcinoma ≥ 3 cm who underwent microwave ablation or resection. There were no significant differences in overall survival curves (A) and progression free survival curves (B) between MWA group and SR group in total cohort for hepatocellular carcinoma ≥ 3 cm (p = 0.548, p = 0.306). And there were no significant differences in overall survival curves (C) and progression-free survival curves (D) between MWA group and SR group in PSM cohort for hepatocellular carcinoma ≥ 3 cm (p = 0.457, p = 0.397).
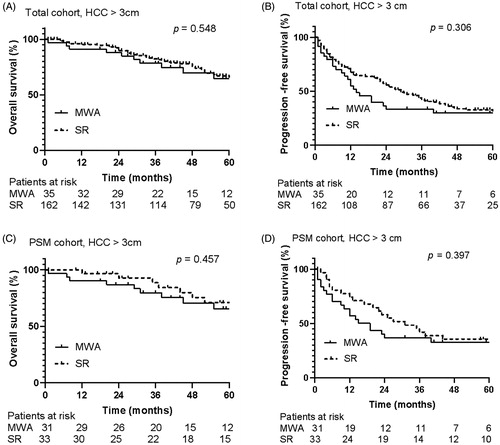
Figure 3. Overall survival and progression-free survival curves of patients with hepatocellular carcinoma ≤ 5 cm who underwent microwave ablation or resection. There were no significant differences in overall survival curves (A) and progression free survival curves (B) between MWA group and SR group in total cohort for hepatocellular carcinoma ≤ 5 cm (p = 0.879, p = 0.932). And there were no significant differences in overall survival curves (C) and progression-free survival curves (D) between MWA group and SR group in PSM cohort for hepatocellular carcinoma ≤ 5 cm (p = 0.965, p = 0.801).
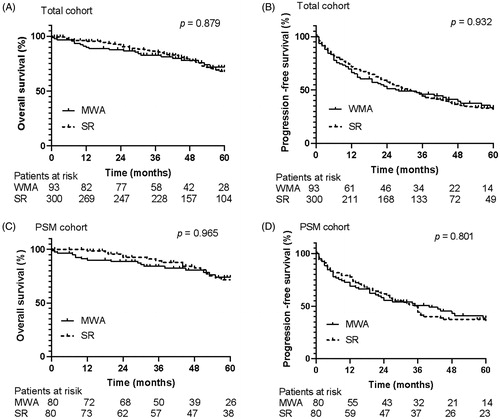
Table 2. Subgroup analysis for the total cohort and the PSM cohort.
Table 3. Factors associated with OS of the total cohort and the PSM cohort for HCC up to 5 cm.
Table 4. Factors associated with PFS of the total cohort and the PSM cohort for HCC up to 5 cm.