
Figures & data
Table 1. Clinical characteristics of patients before RFA.
Figure 1. US image of a 48-year-old female with a benign thyroid nodule. (a) Before RFA, US image showed a solid benign thyroid nodule located in the left thyroid lobe with an initial volume of 1.78 ml. (b) At 1 month after RFA, the volume of nodule was 0.98 ml and the VRR was 44.65%. (c) At 36 months after RFA, nodule shrunk to 0.21 ml and the VRR was 88.05%.
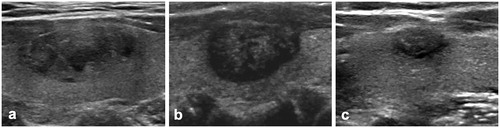
Figure 2. The Bland–Altman plots of volume by the observers during the follow-up period. The Bland–Altman plots of volume measured by the two observers at 1, 3, 6, 12, 24 and 36 months after RFA are shown from (a) to (f). Logarithmic transformation was used to show the data. The x-axes showed the log means of volume measurements by the observers. The y-axes showed the log differences between the observers. Solid lines were the mean difference (bias). Top and bottom dashed lines correspond to upper and lower margins of 95% limits-of-agreement (LOA).
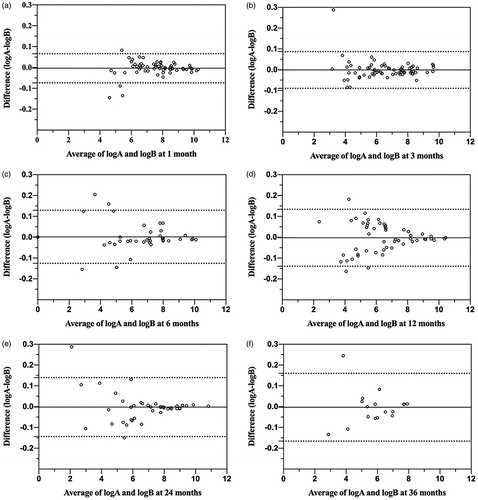
Figure 3. The Bland–Altman plots of VRR by the observers during the follow-up period. The Bland–Altman plots of VRR measured by the two observers at 1, 3, 6, 12, 24 and 36 months after RFA are shown from (a) to (f). Logarithmic transformation was used to show the data. The x-axes showed the log means of VRR measured by the observers. The y-axes showed the log differences between the observers. Solid lines were the mean difference (bias). Top and bottom dashed lines correspond to upper and lower margins of 95% limits-of-agreement (LOA).
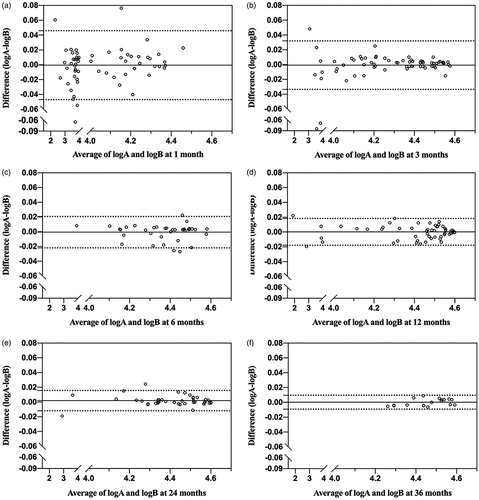
Table 2. Volume and VRR measured by two observers at each follow-up period of RFA.
Table 3. Inter-observer reliability of volume and VRR during the follow-up by the Bland–Altman analysis.
Figure 4. The Bland–Altman plots of volume in the regrowth group by the observers during the follow-up period. The Bland–Altman plots of volume in the regrowth group measured by the two observers at 1, 3, 6, 12, 24 and 36 months after RFA are shown from (a) to (f). Logarithmic transformation was used to show the data. The x-axes showed the log means of volume measurements by the observers. The y-axes showed the log differences between the observers. Solid lines were the mean difference (bias). Top and bottom dashed lines correspond to upper and lower margins of 95% limits-of-agreement (LOA).
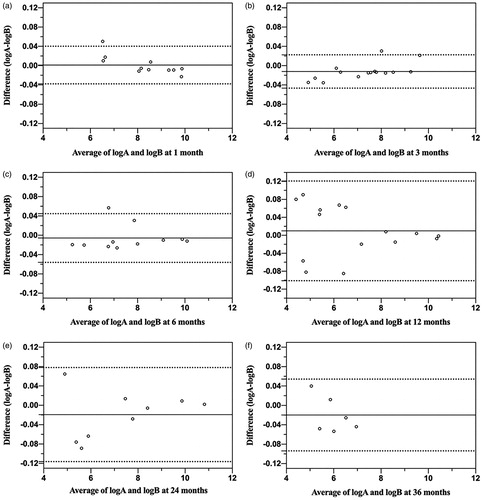
Table 4. Inter-observer reliability of volume in the non-regrowth group and regrowth group during the follow-up by the Bland–Altman analysis.