Figures & data
Figure 1. Collagen fiber and smooth muscle cell content in Masson staining images: microscopic magnification (4 × 10). Photoshop analysis software was used to analyze the image pixels. (A) Fibroid tissue obtained using needle biopsy (B) Pixel image of the whole fibroid tissue. The pixel value of this field is 86,250 (C) Pixels of the blue collagen fiber. The pixel value of this field is 23245.(D) Pixel image of the red smooth muscle cells. The pixel value of this field is 27105.
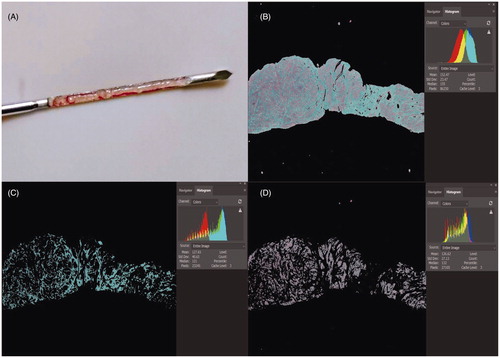
Figure 2. Pathological images of different types of uterine fibroids. (A) The content of smooth muscle cell was rich and the collagen fibers showed a thin, scattered distribution. (B) The content of smooth muscle cell was rare and the collagen fibers were thick, densely arranged and showed a bunched distribution. (C) The content of smooth muscle cell was lower, and the collagen fibers were of different thicknesses and were densely arranged.
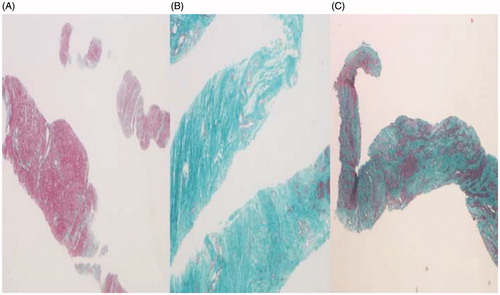
Table 1. The morphology and distribution of SMCs and CFs obtained through the pathological examination of uterine fibroids.
Figure 3. The SWV values, enhanced MRIs of postoperative uterine fibroids, and images of tissues at low power (4 × 10). (A) Preoperative fibroids with SWV values of 2.89 m/s and an ablation rate of ≥70%. (B) Enhanced MRI showing no residual mass. (C) Preoperative biopsy images of uterine fibroids. (D) Fibroid tissue at low power (4 × 10) and an ablation rate of ≥70%. (E) Preoperative fibroids with a SWV value of 4.62 m/s and an ablation rate of <70%. (F) Enhanced MRI showing residual mass with an ablation rate of <70%. (G) Preoperative biopsy images of the uterine fibroids. (H) Fibroid tissue at low power (4 × 10) and an ablation rate of <70%.
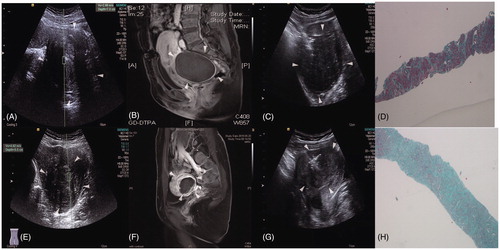
Figure 4. Scatter diagram of the correlation between the SWV value of the uterine fibroids and content of smooth muscle cells and collagen fibers.
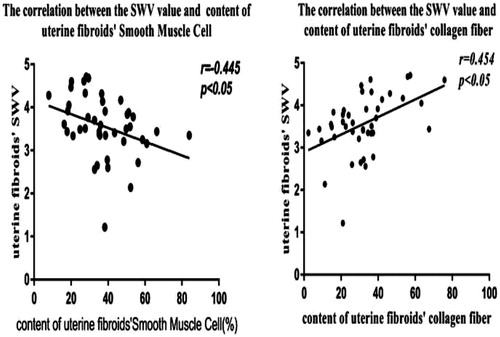
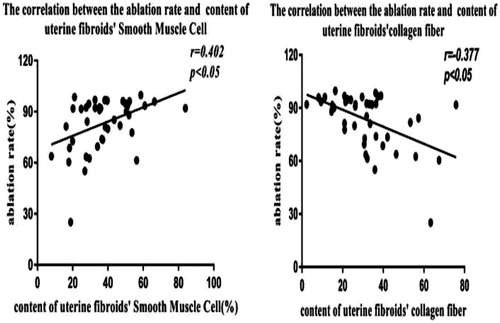
Figure 5. Scatter diagram of the correlation between the ablation rate of uterine fibroids and the content of smooth muscle cells and collagen fiber.