
Figures & data
Figure 1. Evaluation of the technical success and technique efficacy after stereotactic radiofrequency ablation (SRFA) through conventional side-by-side juxtaposition of pre- and post-interventional CT-scans as shown to the participants of the so-called ‘ablation assessment quiz’.
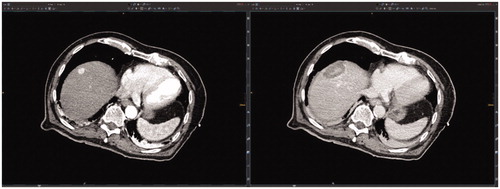
Figure 2. Case 1 of the so-called ‘ablation assessment quiz’: 63-year old male with a 34 mm HCC. Axial plane of pre-interventional CT-scan (a) with HCC in liver segment III (black arrow) and post-interventional CT-scan (b) with large necrosis zone (black dashed circle). (c) Axial plane after image fusion of pre- and post-interventional CT-scans with a rigid registration tool (Syngo.via, Siemens Healthineers, Erlangen, Germany) revealing a MAM of 2 mm. Axial (d) and coronal (e) plane after image fusion of pre- and post-interventional CT-scans with a non-rigid registration tool (Ablation-fit, R.A.W. Srl, Milano, Italy) revealing a lack of sufficient MAM in caudal position (orange line = HCC; green line = HCC with 5 mm margin; blue = necrosis zone; yellow area = unablated safety margin). (f) LTP with 10 mm in diameter caudally to necrosis zone 19 months after the intervention (black arrow).
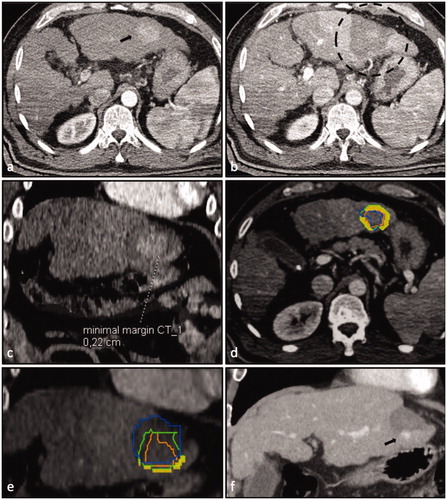
Table 1. Patient/tumor characteristics of nine HCCs presented to the participants of the ‘ablation assessment quiz’.
Table 2. Country of the institution of 38 participants.
Table 3. Characteristics of 38 participants of the ‘ablation assessment quiz’ performed at the ESIR course ‘reliability in percutaneous ablation’ hosted at the Department of Radiology of the Medical University of Innsbruck (12–13th December 2019).
Table 4. Misjudged cases per participant in the ‘ablation assessment quiz’: experienced (more than 50 liver RFA/MWAs) vs. unexperienced interventional radiologists (less than 50 liver RFA/MWAs).
Table 5. Misjudgments of participants in the ‘ablation assessment quiz’ subdivided per case and group: experienced (more than 50 liver RFA/MWAs) vs. unexperienced interventional oncologists (less than 50 liver RFA/MWAs).