Figures & data
Figure 1. (a) Simulation geometry. The bottom surface of the tissue cylinder was electrically grounded. (b) Views of the simulation geometry showing the parameters α, d1, and d2. Note that the distance d1 is negative if the blood vessel axis is located below the center of the RF-needle active region in the side view shown and vice versa. (c) Enlarged view of the RF-needle geometry showing the definition of parameter λ. The axial length from the top surface to the active surface is 50 mm.
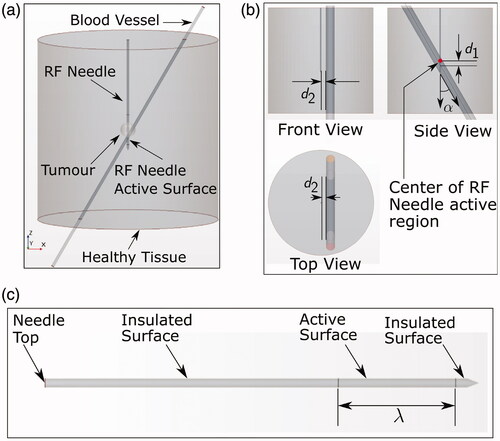
Table 1. Table showing material property values used.
Figure 2. Paths followed by blood particles traversing the blood vessel. The definition of the z coordinate used in the calculation is also shown.
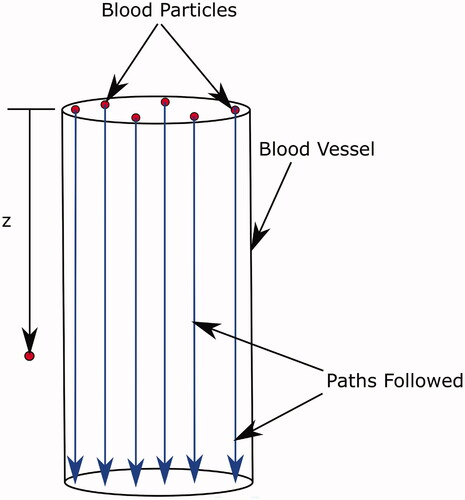
Figure 3. (a) 3D schematic of the geometry showing the phantom cube and RF-needle orientation. (b) Schematic of the top view of the phantom geometry. Cube dimensions and RF-needle dimensions are shown.
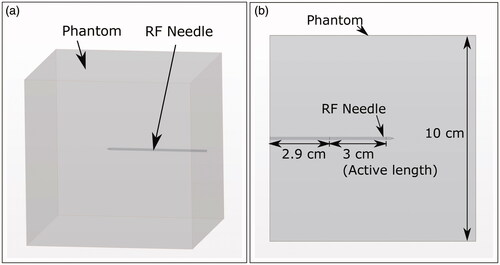
Table 2. Convection coefficient values for external boundaries. [Citation21].
Figure 4. Axial cross-section of post-ablation thermochromic gel phantom. During the experiment, the temperature in the phantom exceeded 70 C in the magenta zone. The blue outline marks the same zone predicted by the model.
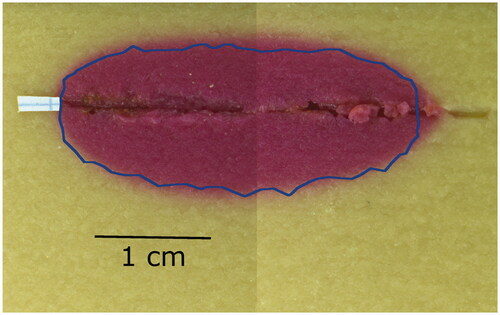
Table 3. Parameter values used for simulations of SET A.
Table 4. Vessel radii used for simulations of SET B.
Figure 5. Schematic of the cooling effect (black outline) and the directional effect (green line) of a blood vessel on a thermal lesion. The cooling effect reduces the lesion size, while the directional effect causes stretching in the flow direction. Definition of and
used to define the ΔA directional effect metric shown. The cross-section is the one containing the vessel axis and the shortest line segment connecting the vessel axis and the RF-needle axis.
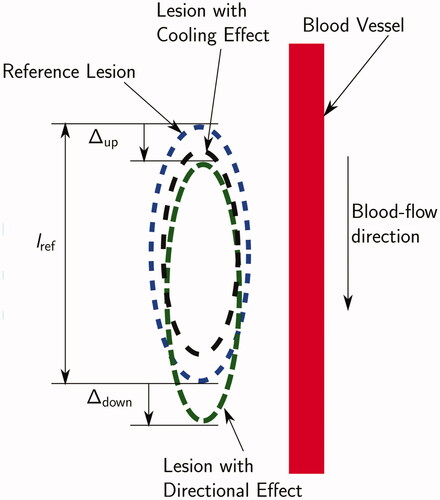
Figure 6. Results obtained from simulations of SET A.
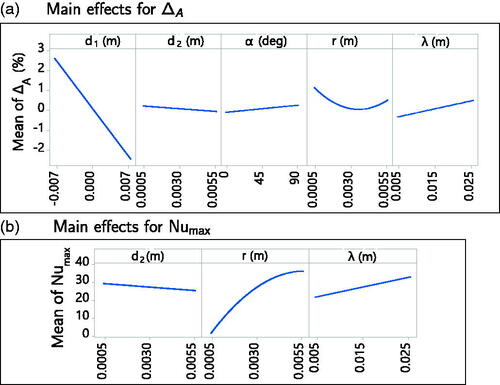
Figure 7. (a) Location of the vessel cross-section at which thermal damage is calculated. (b–h) Arrhenius survival fraction ω for the vessel cross-sections for SET B computed at the blood outlet. A value of corresponds to blood coagulation. The RF-needle was located below the cross-section.
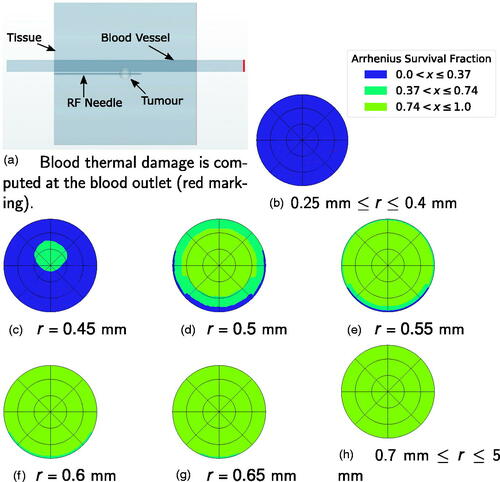
Table 5. Time required for complete coagulation of the blood vessel cross-section.
Figure 8. Thermal lesion at the end of the simulation for 0.25 mm 0.7 mm. The tissue section containing the vessel axis and the RF-needle axis is shown. The top horizontal band in each image is the blood vessel section. Blood flow was from right to left. The bottom horizontal ‘half-band’ is the RF-needle. Blue indicates healthy tissue and red indicates ablated tissue. The white circle is the tumor boundary.
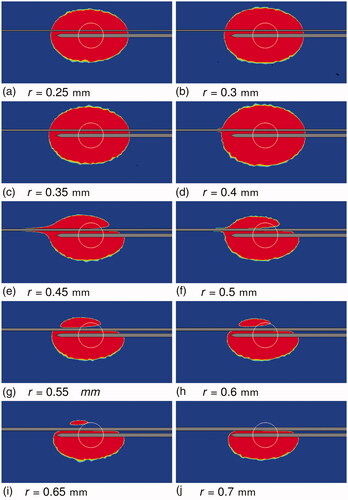
Figure 9. Tissue thermal damage at the end of the simulations for 0.75 mm 5 mm. Sub-figure (h) shows the reference lesion. The tissue section containing the vessel axis and the RF-needle axis is shown. The top horizontal band in each image is the blood vessel section. Blood flow was from right to left. The bottom horizontal ‘half-band’ is the RF-needle. Blue indicates healthy tissue and red indicates ablated tissue. The white circle is the tumor boundary.
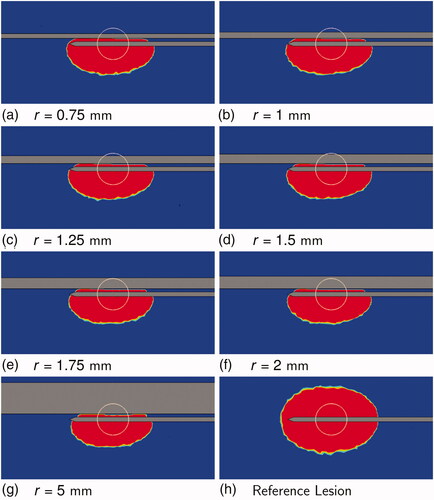
Figure 10. Classification of blood vessels into regions based on the occurrence of a directional effect.
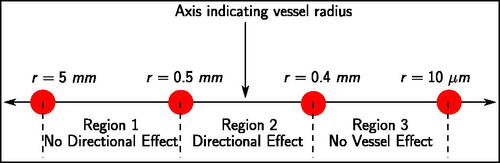
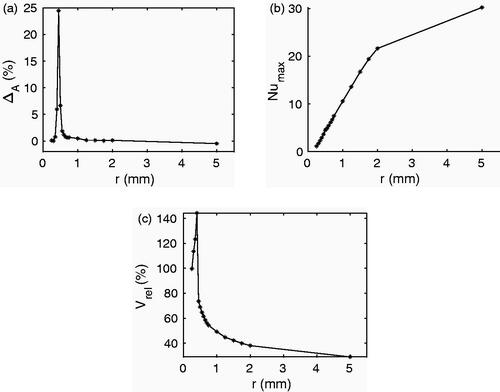
Figure 11. Effect of vessel radius on (a) directional effect ΔA, (b) Nusselt number and (c) relative ablated volume
metrics for simulations of SET B.