Figures & data
Figure 1. Transcranial MR guided focused ultrasound of an 87-year-old woman with essential tremor. Sagittal T2 weighted Fast Spin Echo (T2wFSE) treatment planning image of the brain acquired with the volume body coil shows the characteristic spatially varying signal loss through the thalamus and vertex (red arrows) due to the transducer array and water bath.
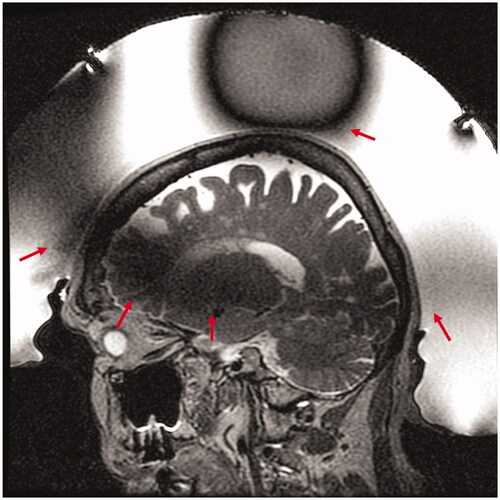
Figure 2. Dual channel RF head coil (red arrows) for transcranial MR guided focused ultrasound. The head coil is encased in a silicone membrane and integrated into the membrane that contains the coupling water inside the transducer. In this picture, the membrane and coil are shown surrounding a phantom that is held inside the transducer through a frame. In humans, the loop coils surround each ear next to a stereotactic head frame and extend into the water bath.
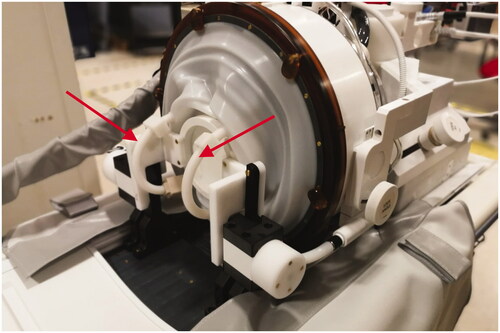
Figure 3. tcMRgFUS receive-only head coil schematic. Coil elements are decoupled using passive circuits that are switched on and off during transmission or reception. The signal from each coil loop passes through a dedicated low noise amplifier (LNA). RF traps are used to attenuate cable shield currents. Tracker coils used during treatment to locate the transducer coordinates are also integrated into the coil connector module.
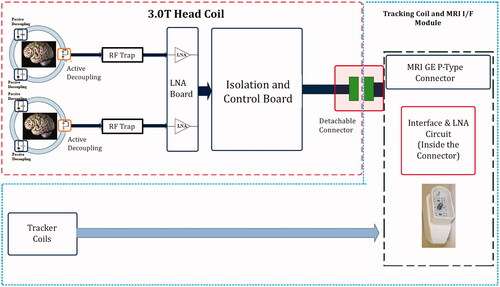
Figure 4. Receive sensitivity maps of the head coil corrected for B1 in a spherical phantom for (a) channel 1, (b) channel 2, and (c) combined. The horizontal (red) and vertical (green) profiles through the combined image show a normalized signal intensity variation of 25% across the horizontal and 35% variation across the vertical center of the phantom.
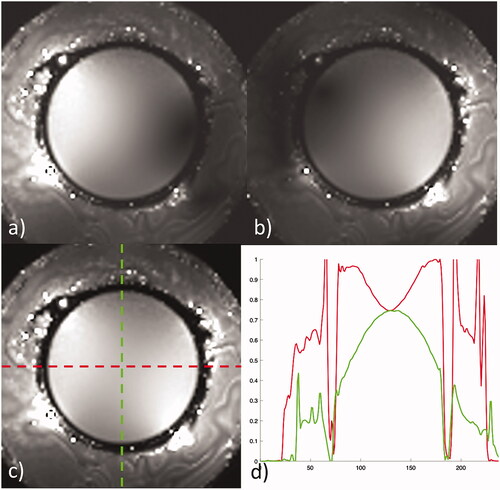
Figure 5. Comparison of image quality of T2wFSE treatment planning images in one volunteer without and with the tcMRgFUS head coil in the transducer water bath treatment setup. Head coil images provide greater detail of the thalamus, globus pallidus and subthalamic nucleus on axial images (orange arrows), and the anterior/posterior commissure (AC/PC), brain stem, and cerebellum on sagittal images.
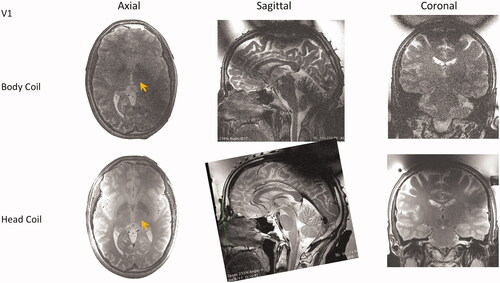
Figure 6. Comparison of image quality of GRE thermometry magnitude images in two volunteers without (a, b) and with (c, d) the tcMRgFUS head coil in the transducer water bath treatment setup.
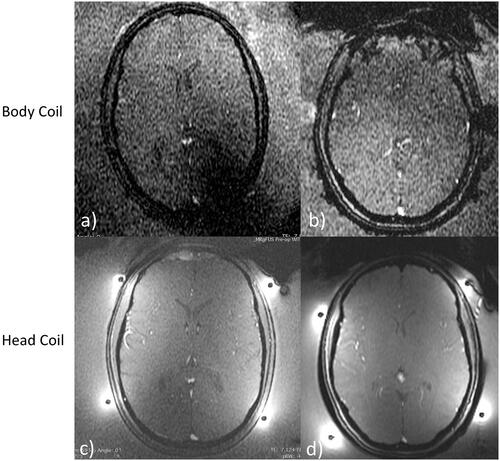
Figure 7. Comparison of mean SNR measured in the thalamus (a, green circle) using volume body coil or head coil. (b) Comparison using T2wFSE planning images is shown in 3 planes, and for thermometry images in the axial plane. Mean SNR was normalized to the maximum SNR across volunteers for each respective sequence type. Data are mean SNR ± standard deviation. For T2wFSE SNRnorm = 0.20 ± 0.05, 0.26 ± 0.03, and 0.25 ± 0.05 for the volume body coil, and SNRnorm = 0.95 ± 0.20, 1 ± 0.38, 0.85 ± 0.10 for the head coil, in the axial, sagittal, and coronal planes, respectively. For the thermometry sequence SNRnorm = 0.23 ± 0.04 for the volume body coil and SNRnorm = 1 ± 0.42 for the head coil.
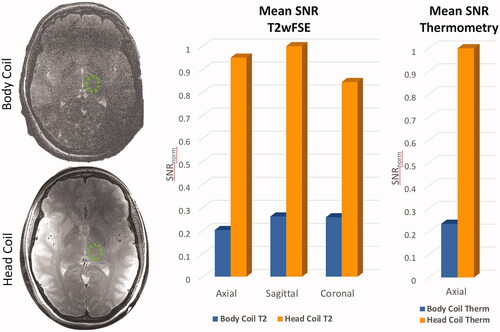
Figure 8. Temperature uncertainty in the brains of two volunteers using the volume body coil (left) and tcMRgFUS head coil (right). The σT is calculated as the spatial average of the standard deviation across the brain. Uniformity and σT is improved using the head coil (Body Coil σT = 0.96 °C ± 0.55 °C, and Head Coil σT = 0.41 °C ± 0.24 °C).
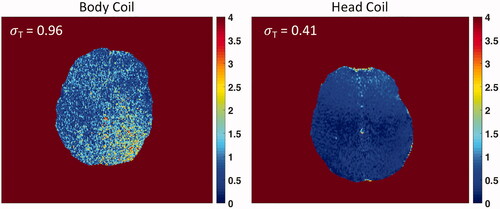
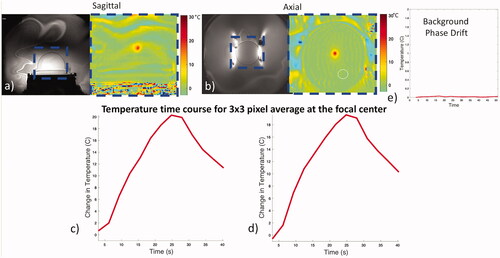
Figure 9. Coil performance during thermal heating. Magnitude (a, b left) and combined phase difference temperature maps (a, b right) for sonications in the sagittal and axial planes. Heating is restricted to the focus and follows a typical heating rise-decay curve (c, d). Minimal background phase variation was observed using an ROI away from the focal spot (white circle) over time (e).