
Figures & data
Table 1. Patient’s demographic, clinical and US characteristics.
Table 2. Per ablation assessment.
Table 3. Post ablation assessment.
Figure 1. Six months follow-up volume reduction ratio (VRR) (vertical axis in %) against case number (horizontal axis), showing moderate increase of VRR over time.
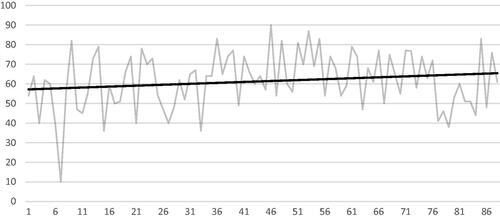
Figure 2. Six months follow-up of ablation ratio (AR) (vertical axis in %) against case number (horizontal axis), showing marked increase of AR over time.
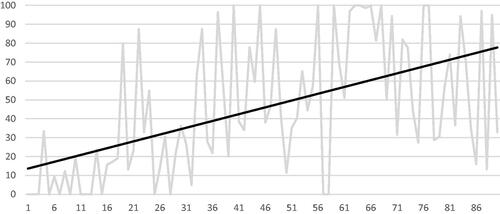
Figure 3. (A) Example of incomplete ablation in longitudinal plane. Left part of picture shows nodule before treatment (upper picture: color Doppler, lower picture: strain elastography) with moderate central vascularity and low heterogeneous stiffness. The right part of the picture shows the same nodule after treatment (same techniques). The upper and inferior part of the nodule has turned hypoechoic, avascular and with high stiffness, corresponding to the ablated volume, representing only a fraction of the remaining volume. (B) Example of nearly complete ablation in longitudinal plane. Left part of picture shows nodule before treatment (upper picture: color Doppler, lower picture: strain elastography) with moderate central vascularity and low heterogeneous stiffness. The right part of the picture shows the same nodule after treatment (same techniques). Nearly the entire nodule has turned hypoechoic, avascular and with high stiffness, corresponding to the ablated volume, representing the main fraction of the remaining volume.
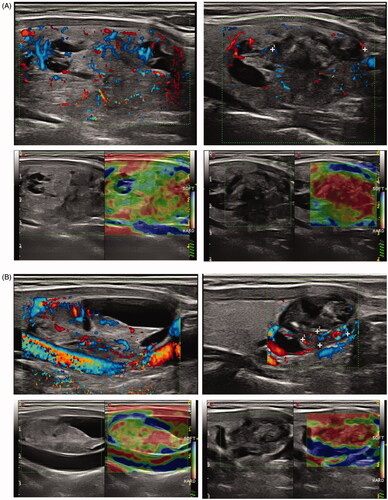
Figure 4. Correlation analysis between delivered energy per volume (horizontal axis in J/mL) and volume reduction ratio (VRR in %), showing moderate increase of VRR with delivered energy.
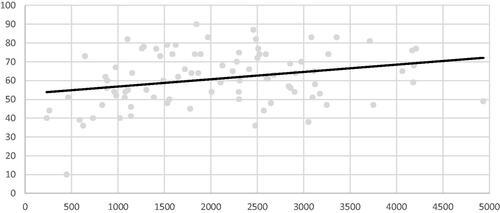
Figure 5. Correlation analysis between delivered energy per volume (horizontal axis in J/ml) and ablation ratio (AR) at 6 months follow-up in %, showing marked increase of AR with delivered energy per volume.
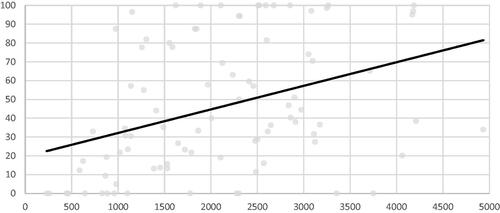
Figure 6. Time tendency curves of energy delivered per mL (red curves, left scale in J/mL) and RFA application time (blue curves, right scale in min) showing increasing values of these two parameters with time-experience. Horizontal axis: case number.
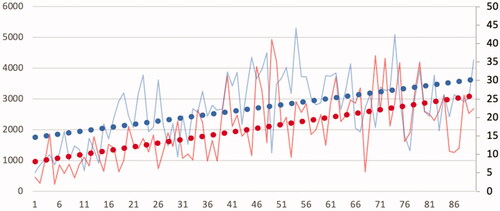
Table 4. Multivariable analysis of factors predicting volume reduction ratio (VRR) and ablation ratio (AR).
Data availability statement
The datasets generated and/or analyzed during the current study are not publicly available but can be provided by the corresponding author on reasonable request.