Figures & data
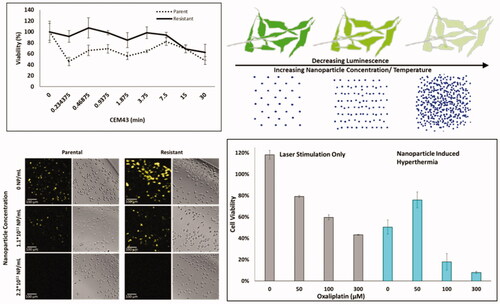
Figure 1. (A) IC50 values of oxaliplatin in OxR CT26 cells as a function of induction time. At approximately 400 days of intermittent treatment, the following IC50 value of CT26-OxR was 48.0 µM, accounting for a near order-of-magnitude increase. (B) Cell viability of parental and OxR CT26 cells in response to increasing thermal dose. ‘*’ indicates a significant difference in viability between the parental and resistant populations. (C) Loss of luminescence (normalized) as a function of treatment time at 37, 40, and 42 °C in CT26 parental and OxR (D) cells. Translation of treatment time and temperature to CEM43 and plotting relative to the loss of luminescence (normalized) shows valid applicable ranges for the luminescence-intensity correlation from 0.04-8.33 CEM43 (Parental) (E) and 0.05–9.74 CEM43 (OxR) (F), where corresponding normalized RLU values are between 1 and 0.
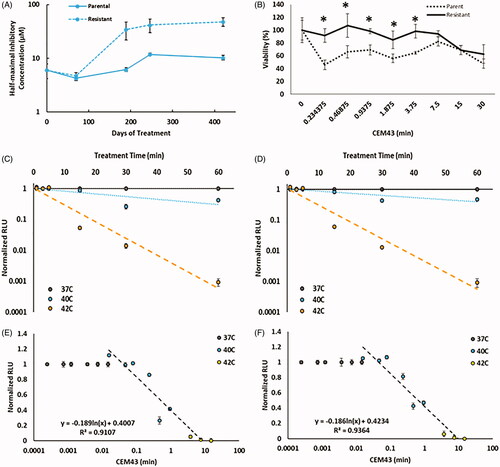
Figure 2. Measurement of HDAPPs absorbance and fluorescence (A) spectra shows retention of the characteristic HDAPPs absorbance and fluorescence before and after UV-sterilization. Frequency plots of nanoparticle size measured by NTA in scatter (B) and fluorescence (C) modes show good agreement in HDAPPs size, 80.2 and 82.5 nm, respectively. (D) Measurement of photothermal heat generation reveals HDAPPs maintain the capacity to reach ablative potential (ΔT = 8 °C) at relatively low concentrations. (E) Increasing concentrations of HDAPPs during laser exposure demonstrate progressive changes in solution temperature.
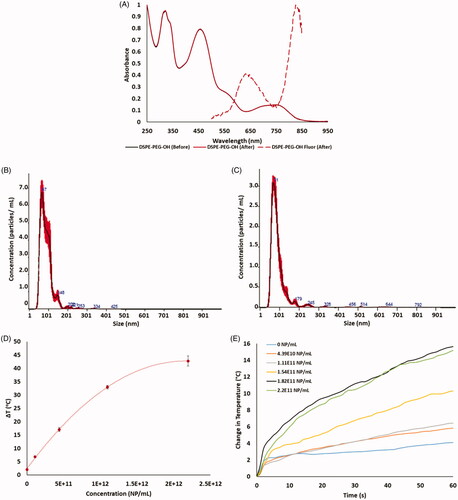
Table 1. HDAPPs concentration and the corresponding average and maximum temperature rise over baseline during stimulation with 60 s of 800 nm (3 w/cm2) continuous-wave light.
Figure 3. (A) Normalized percent loss of luminescence intensity as a function of nanoparticle concentration and CT26 cell variant under 60 s irradiation with 3 W, 800 nm continuous wave laser (1 cm2 spot size). Temperatures provided are interpolated values from experimental data collected in . (B) Correlated CEM43 as a function of nanoparticle concentration and CT26 cell variant. Solid gray bars indicate CEM43, as measured with a thermocouple in bulk solution, using the average temperature over 60 s. Gray bars with lines are CEM43 calculations using the sum of CEM43 values attained using 1 s (horizontal stripes), 5 s (diagonal stripes) or 10 s (vertical stripes) intervals. (C) Visual confirmation of loss of luminescence under respective nanoparticle concentrations in both parental and OxR CT26 cell lines. EM-CCD imaging allows resolution down to a single cell. (D) RLU decreases calculated by measuring 90 individual cells per group, as shown in part C.
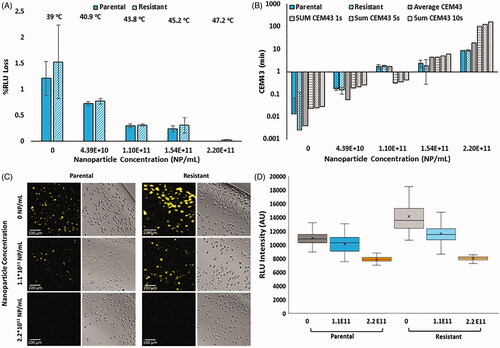
Figure 4. Cell viability of parental and OxR cells measured immediately after HDAPPs- induced photothermal therapy (A) and 24 h after treatment (B). ‘§’ indicates statistical significance between the identified group and the no nanoparticle group. § indicates statistical significance between the laser and non-laser treated groups within the same cell line and nanoparticle concentration. NL indicates no laser and L indicates the application of the laser stimulation.
*Signifies that there are statistical differences between oxaliplatin resistant cells treated with laser (L) compared to without (NL), or in the case of the highest nanoparticle concentration, that there are differences in the oxaliplatin sensitive cells treated with laser (L) versus without (NL).
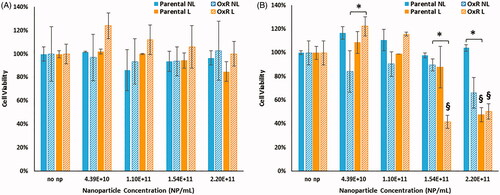
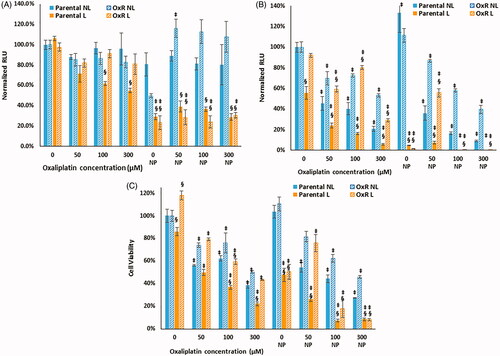
Figure 5. Parental and OxR cells were treated with increasing concentrations of oxaliplatin and with or without 2.2 × 10¹¹ NP/mL, with or without laser exposure for 60 s. (A) Luminescence measured immediately after photothermal treatment and (B) measured 24 h after. (C) Cell viability measured 24 h after photothermal treatment. ‘§’ indicates a statistical significance between cells treated with laser stimulation or not. ‡ indicates statistical significance between the indicated group and their respective parental or OxR cells that did not receive HDAPPs or oxaliplatin. NL indicates no laser and L indicates the application of the laser stimulation.