
Figures & data
Figure 1. Radiation dose-response curves for C3H mammary carcinomas treated with either radiation alone (○, Δ) or radiation followed one hour later by heating at 41.5 °C for 60 min (●, ▲). The radiation treatment was administered using either an experimental Philips X-ray tube (○, ●) or a clinical Varian Clinac iX Linear Accelerator (Δ, ▲). Results show percentage of animals with local tumor control at 90 days after treating and are based on a minimum of 7 mice/group. Lines through the data were fitted following logit analysis.
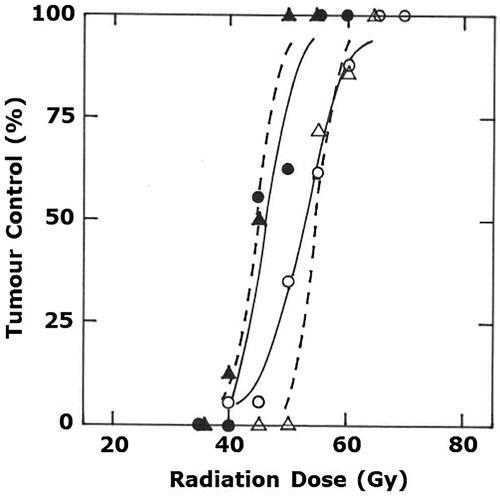
Figure 2. The effect of different heat temperatures on the radiation response of C3H mammary carcinomas. Data similar to that shown in was produced for all temperatures shown and from the resulting radiation dose-response curves the TCD50 (radiation dose that causes 50% tumor control) values were calculated. The symbols represent the enhancement ratios (ratio of the TCD50 value for radiation alone compared to radiation and heat) with 95% confidence intervals and are for radiation applied in the middle of the heating period (●) or when heat was given 4-h after irradiating (○) and includes both previously published data [Citation21, Citation25, Citation27, Citation28] and more recent unpublished results. Shaded area shows the 95% confidence interval for carbon ion irradiated tumors, taken from [Citation29]. *Indicates the heat and radiation values that were significantly different from the carbon ion value (t-test; p < .05).
![Figure 2. The effect of different heat temperatures on the radiation response of C3H mammary carcinomas. Data similar to that shown in Figure 1 was produced for all temperatures shown and from the resulting radiation dose-response curves the TCD50 (radiation dose that causes 50% tumor control) values were calculated. The symbols represent the enhancement ratios (ratio of the TCD50 value for radiation alone compared to radiation and heat) with 95% confidence intervals and are for radiation applied in the middle of the heating period (●) or when heat was given 4-h after irradiating (○) and includes both previously published data [Citation21, Citation25, Citation27, Citation28] and more recent unpublished results. Shaded area shows the 95% confidence interval for carbon ion irradiated tumors, taken from [Citation29]. *Indicates the heat and radiation values that were significantly different from the carbon ion value (t-test; p < .05).](/cms/asset/61313cd3-0e69-45b4-94c5-cce189eb5178/ihyt_a_1876929_f0002_b.jpg)
Figure 3. The effect of varying the time interval between radiation and heat on the radiation response of C3H mammary carcinomas. Data similar to that shown in was produced for all temperatures shown and from the resulting radiation dose-response curves the TCD50 (radiation dose that causes 50% tumor control) values were calculated. The symbols represent the enhancement ratios (ratio of the TCD50 value for radiation alone compared to radiation and heat) with 95% confidence intervals and are for radiation combined with 42.5 °C (●) or 41.5 °C (○) and includes both previously published data [Citation25, Citation27, Citation28] and more recent unpublished results. Shaded area shows the 95% confidence interval for carbon ion irradiated tumors, taken from [Citation29]. *Indicates the heat and radiation values that were significantly different from the carbon ion value (t-test; p < .05).
![Figure 3. The effect of varying the time interval between radiation and heat on the radiation response of C3H mammary carcinomas. Data similar to that shown in Figure 1 was produced for all temperatures shown and from the resulting radiation dose-response curves the TCD50 (radiation dose that causes 50% tumor control) values were calculated. The symbols represent the enhancement ratios (ratio of the TCD50 value for radiation alone compared to radiation and heat) with 95% confidence intervals and are for radiation combined with 42.5 °C (●) or 41.5 °C (○) and includes both previously published data [Citation25, Citation27, Citation28] and more recent unpublished results. Shaded area shows the 95% confidence interval for carbon ion irradiated tumors, taken from [Citation29]. *Indicates the heat and radiation values that were significantly different from the carbon ion value (t-test; p < .05).](/cms/asset/0c65b3ff-a1f5-4c79-b313-3e592136cb20/ihyt_a_1876929_f0003_b.jpg)