Figures & data
Table 1. Relevant gastrointestinal gas (GG) volume (i.e. GG located within the radiotherapy 20% isodose surface) for CT and CBCTs [Citation40].
Figure 1. Schematic of data analysis: (a) CT, (b) segmented CT (sCT), (c) sCT with gas replaced by muscle (sCT0), (d) cone-beam CT (CBCT), (e) segmented gas from CBCT (GG-CBCT), (f) sCT with GG-CBCT inserted (sCTCBCT), (g) calculated temperature distributions, (h) cumulative volume-temperature histograms. Structures sCT, sCT0 and sCTCBCT were used for temperature calculations. Note: for calculations, segmented external air was replaced by water bolus.
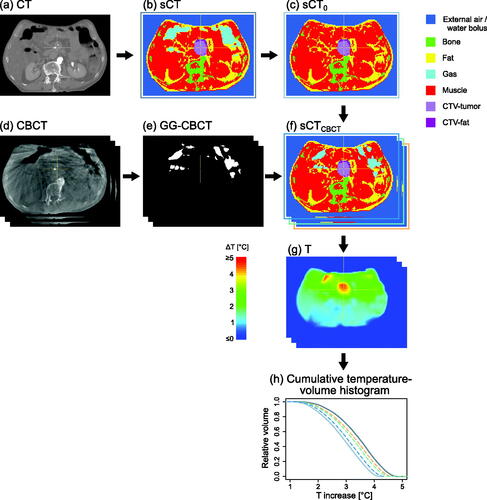
Table 2. Values of the dielectric and thermal properties for gastrointestinal gas and different tissue types at 70 MHz, used in the simulations.
Figure 2. Example of imaging data and calculation results for patient P7, with (a) CT scan, (b) CBCT of 5th fraction, (c) segmented CT (sCT), (d) sCTCBCT, i.e. sCT with GG-CT replaced by muscle and GG-CBCT inserted, (e) temperature distribution for sCT, (f) temperature distribution for sCTCBCT. GG volume was 699 cm3 for sCT (c) and 260 cm3 for the sCTCBCT (d). Note: for calculations, segmented external air was replaced by water bolus.
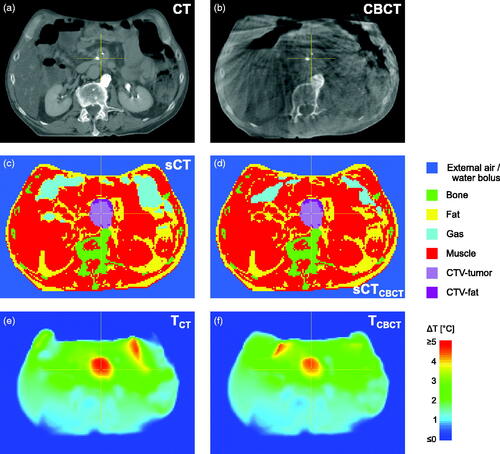
Table 3. Results of this study.
Figure 3. (Left column) For four patients, cumulative temperature-volume histograms of clinical target volume (CTV), for sCT, sCT0 and sCTCBCT data for eight fractions. (Right column) Relation between ΔT50 and volume of gastrointestinal gas (GG) for sCT (dark gray double circle), sCT0 (light gray double circle) and sCTCBCT (colored dots); R2 is the coefficient of determination for the linear fit (dashed line) to the ten data points.
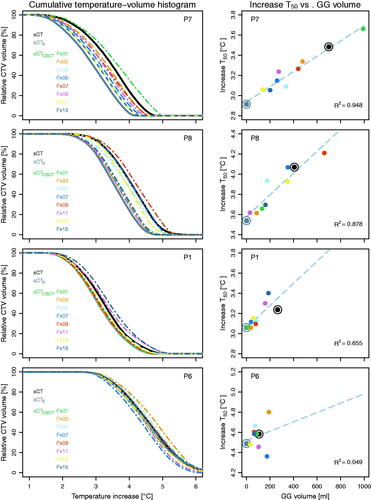
Figure 4. sCTCBCT with colorwash of corresponding temperature distribution, for patient P1, 11th fraction (a; GG volume = 158 cm3) and 13th fraction (b; 58 cm3), and patient P7, 1st fraction (c; 991 cm3) and 9th fraction (d; 275 cm3). Regions of high temperature in normal tissue were generally located near GG. For patient P1, who had more fat tissue, high temperature regions were also found at the anterior fat-muscle interface (a and b). Note: these 2D images show a limited view of the 3D temperature distribution; colorwash only shown for high-temperature regions (ΔT ≈≥ 3.5 °C).
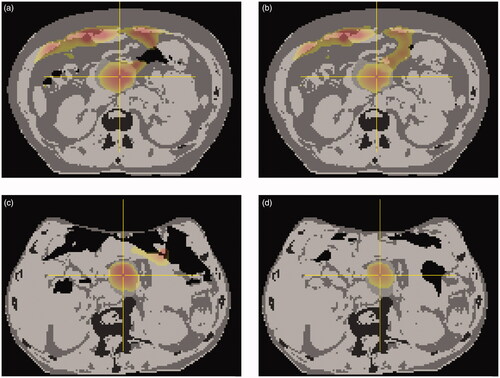
Figure 5. Volume of normal tissue reaching Tref +1 °C and Tref +2 °C, for patients (a) P7, (b) P8, (c) P1 and (d) P6, with Tref = ΔT50 + 37 °C for the CTV for sCT of that patient. Data from temperature distributions for sCT (black), sCT0 (dark gray) and sCTCBCT (colors corresponding to colors in ). Linear fit and corresponding R2 are given for each.
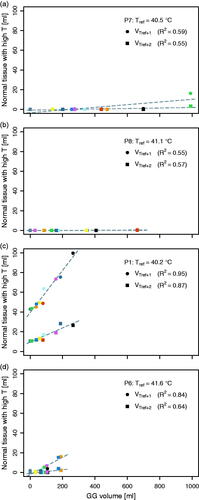
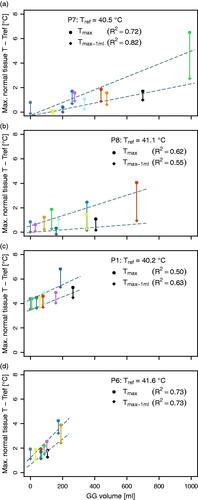
Figure 6. Maximum temperature in normal tissue, Tmax, as well as the maximum temperature in normal tissue when ignoring 1 ml (64 voxels) of normal tissue with highest temperature, Tmax–1 mL; both relative to Tref, with Tref = ΔT50 + 37 °C for the CTV for sCT of that patient. Data from temperature distributions for sCT (black), sCT0 (dark gray) and sCTCBCT (colors corresponding to colors in ). Linear fit and corresponding R2 are given for each.