Figures & data
Figure 1. Flowchart of the inclusion process for the study population.
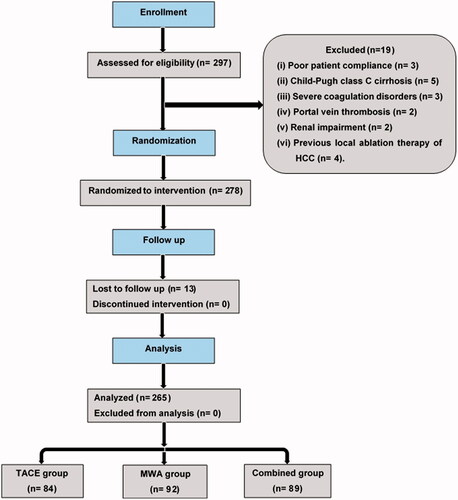
Table 1. Patients’ data.
Table 2. Postoperative adverse events and complications.
Table 3. Follow-up and treatment response.
Figure 2. Comparison of the survival function among the three groups: transarterial chemoembolization (TACE), microwave ablation (MWA), and combined TACE + MWA. The overall survival rate was significantly higher in the combined group (69.6%) than the TACE group (54.8%) and the MWA group (54.3%) (p = 0.02).
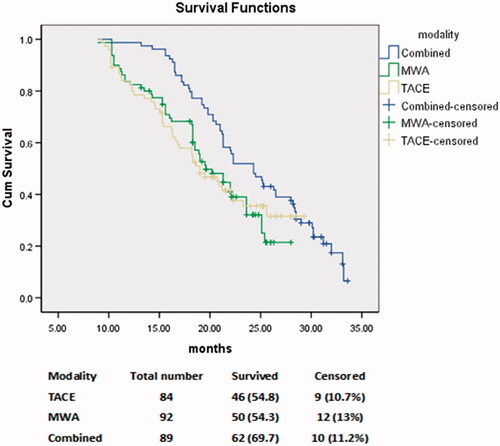
Figure 3. Progression-free survival (PFS) analysis shows that the mean PFS was significantly higher in the combined group (22.3 months) than the TACE group (15.4 months) and the MWA group (16.7 months) (p < 0.001).
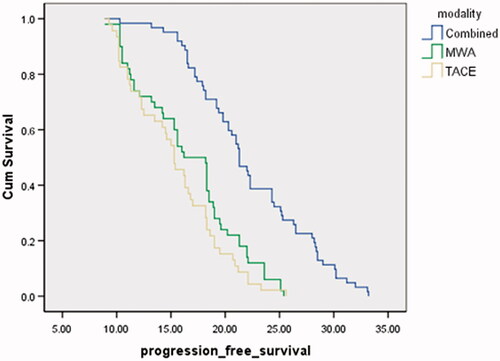
Figure 4. Receiver operating characteristic (ROC) curves show the sensitivity and specificity of serum alpha-fetoprotein concentration response among the three treatment groups: (a) transarterial chemoembolization (TACE), (b) microwave ablation (MWA), and (c) combined TACE + MWA.
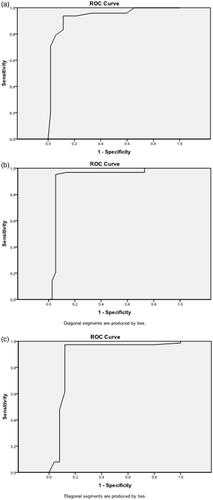
Table 4. AFP evaluation among the three groups.
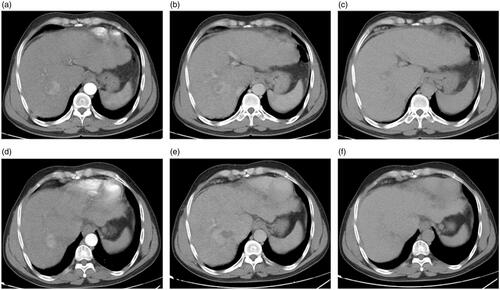
Figure 5. A 65-year-old man with a history of antiviral treatment for hepatitis C virus. Contrast-enhanced MRI before treatment: (a) arterial, (b) portal, and (c) delayed phases show a single 4.9-cm focal lesion at segment VI with HCC criteria (arterial enhancement and delayed washout). The patient underwent TACE and then MWA after two weeks. Follow up contrast-enhanced CT 24 months after the procedure: (d) arterial, (e) portal, and (f) delayed phases show complete response. The effect of MWA is seen in the center of the lesion, and the effect of TACE is seen in the lesion periphery.
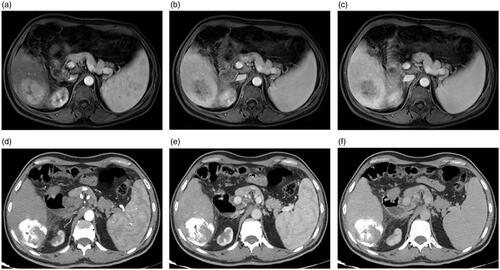
Figure 6. A 60-year-old man with a history of antiviral treatment for hepatitis C virus. Contrast-enhanced CT before treatment: (a) pre-contrast, (b) arterial, and (c) delayed phases show a single 4.8-cm focal lesion at segment VI with HCC criteria (arterial enhancement and delayed washout). TACE was performed and results of follow up contrast-enhanced CT after 12 months are shown: (d) pre-contrast, (e) arterial, and (f) delayed phases show complete response with no significant enhancement or washout. Follow-up contrast-enhanced CT after 24 months are shown: (g) pre-contrast, (h) arterial, and (i) delayed phases show complete response with a significant decrease in the size.
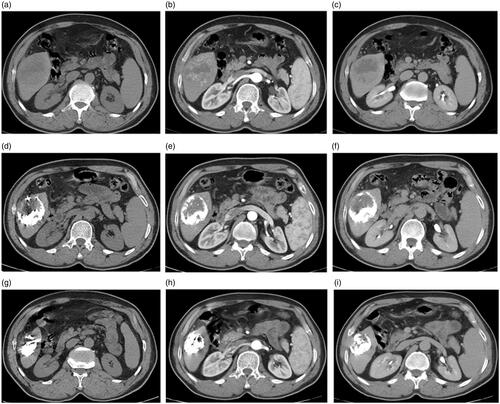
Figure 7. A 54-year-old man with a history of antiviral treatment for hepatitis C virus. Contrast-enhanced CT before treatment: (a) arterial, (b) portal, and (c) delayed phases show a single 4.4 cm focal lesion at segment VII with HCC criteria (arterial enhancement and delayed washout). MWA was performed and results of follow up contrast-enhanced CT after 12 months are shown: (d) arterial, (e) portal, and (f) delayed phases show tumor recurrence with significant enhancement at the arterial phase and characteristic washout at the delayed phases.