Figures & data
Figure 1. Geometry of the computational model with the catheter in perpendicular position (out of scale). Tissue and blood model dimensions (taken from [Citation15]): X = 80 mm, Y = Z = 40 mm, C = 20 mm. Note that XZ-plane is the symmetry plane in the model. The active electrode mimics the multi-holes open-irrigated electrode ThermoCool R SF (Biosense Webster, Diamond Bar, CA, USA). The saline irrigation through the small holes in the electrode-tip is modeled by an inlet velocity boundary condition at the electrode-blood interface. Thermal lesion is assessed by the 50 °C isotherm and its geometry is characterized by: maximum depth (D), maximum width (MW), surface width (SW) and depth at the maximum width (DW) [Citation15].
![Figure 1. Geometry of the computational model with the catheter in perpendicular position (out of scale). Tissue and blood model dimensions (taken from [Citation15]): X = 80 mm, Y = Z = 40 mm, C = 20 mm. Note that XZ-plane is the symmetry plane in the model. The active electrode mimics the multi-holes open-irrigated electrode ThermoCool R SF (Biosense Webster, Diamond Bar, CA, USA). The saline irrigation through the small holes in the electrode-tip is modeled by an inlet velocity boundary condition at the electrode-blood interface. Thermal lesion is assessed by the 50 °C isotherm and its geometry is characterized by: maximum depth (D), maximum width (MW), surface width (SW) and depth at the maximum width (DW) [Citation15].](/cms/asset/2ea24765-8ba1-4e6c-9a8f-97d56e70bfb8/ihyt_a_1890240_f0001_c.jpg)
Table 1. Properties of the model materials [Citation19,Citation20].
Figure 2. Electrical (A) and thermal and blood flow (B) boundary conditions.
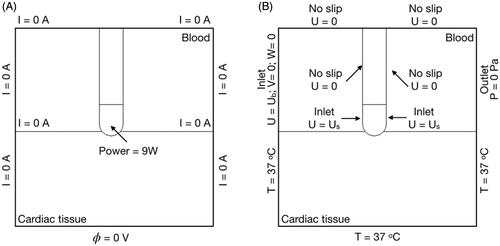
Figure 3. Intracardiac blood flow dynamics (taken from [Citation8] with permission from Wolters Kluwer Health, Inc). The electrocardiogram (ECG) is displayed on the top part of the image. Underneath, three different blood flow profiles are shown: pulmonary artery blood flow (PAF), pulmonary vein blood flow (PVF) and mitral valve blood flow (MVF).
![Figure 3. Intracardiac blood flow dynamics (taken from [Citation8] with permission from Wolters Kluwer Health, Inc). The electrocardiogram (ECG) is displayed on the top part of the image. Underneath, three different blood flow profiles are shown: pulmonary artery blood flow (PAF), pulmonary vein blood flow (PVF) and mitral valve blood flow (MVF).](/cms/asset/43691edb-7b58-40c4-bd4c-f81990c20c98/ihyt_a_1890240_f0003_b.jpg)
Figure 4. Simplified mathematical functions (zoom of the first 5 s) used to simulate the blood flow pulsatile profiles (see text for more details) for a mean velocity of 8.5 cm/s.
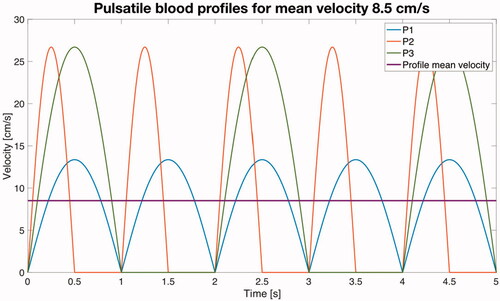
Figure 5. Evolution of the maximum value of temperature in tissue and blood during ablation for the different blood flow profiles (average value 8.5 cm/s) with perpendicular orientation.
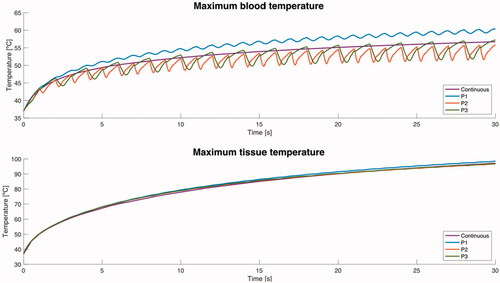
Figure 6. Temperature distributions after 30 s of RFCA with a constant power of 9 W for different catheter orientations: perpendicular (A), 45° with blood flow from left to right (B), 45° with blood flow from right to left –opposed– (C), parallel with blood flow from left to right (D), and parallel with blood flow from right to left – opposed – (E). The solid black line shows the 50 °C isotherm. Each plot shows the maximum temperature reached in blood and tissue (Tmax Blood and Tmax Tissue). The plots correspond to the case of 8.5 cm/s for continuous blood flow (first column), and pulsatile blood flow profiles (P1, P2 and P3, see text for more details). Scale in °C.
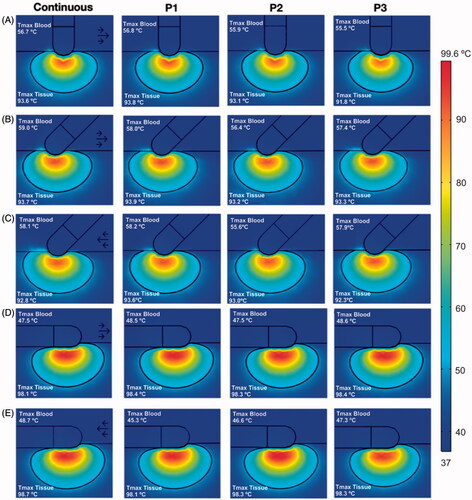
Figure 7. Lesion dimensions (in mm) after 30 s 9 W RFCA for different catheter orientations (A: perpendicular, B: 45°, C: 45° with opposite blood flow direction, D: parallel, E: parallel with opposite blood flow direction) and for different blood velocity profiles (continuous, P1, P2 and P3, all with an average value of 8.5 cm/s) (see text for more details). D: maximum depth; MW: Maximum width; DW: Depth at the maximum width; SW: Surface width.
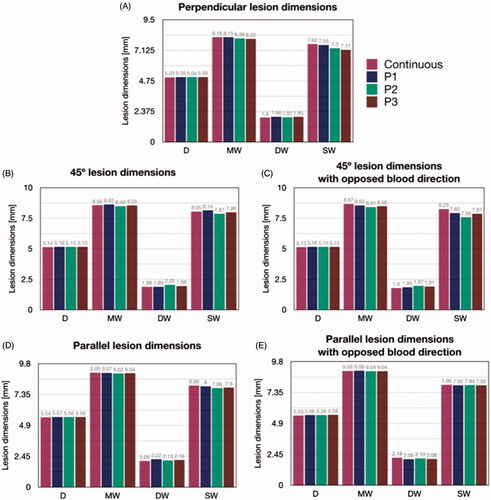
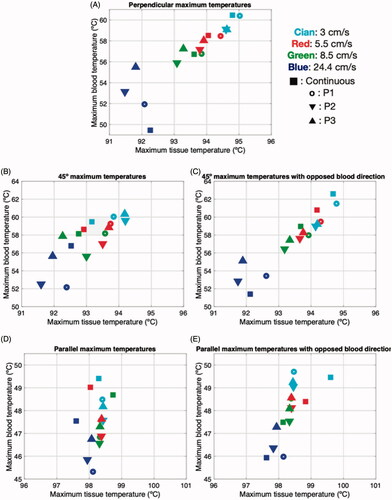
Figure 8. Maximum temperatures in blood and cardiac tissue after 30 s of RFCA with 9 W for different catheter orientations (A: perpendicular, B: 45°, C: 45° with opposite blood flow direction, D: parallel, E: parallel with opposite blood flow direction), average values of blood velocity (3, 5.5, 8.5 and 24.4 cm/s), and profiles of blood flow (continuous, P1, P2 and P3).