
Figures & data
Table 1. MRI sequences and parameters.
Figure 1. Gross specimen and pathological examination of a VX2 tumor after confirmation of successful tumor implantation. (A) The VX2 tumor located in the left lower lobe of the lung (arrow, scale bar = 1 cm). (B) Under the light microscope, the tumor cells occupied most of the lung parenchyma (T), and the tumor even invaded nearby vessels (V) and alveoli (L) (hematoxylin and eosin staining, ×10).
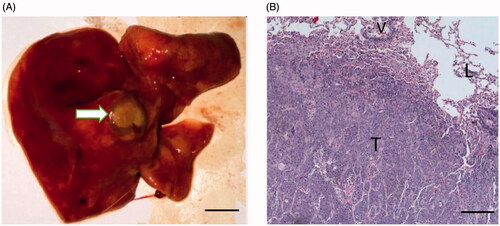
Table 2. General information of rabbits.
Figure 2. Pathological examination of the ablated area and the peripheral lung tissue. (A) After hematoxylin and eosin staining (HE staining), the ablated area demonstrated three layers, including the central necrotic area (tagged with N, scale bar = 500 μm), the intermediate area (tagged with E) and the outermost layer (tagged with C), shown in B (scale bar = 500 μm). (C) At the outermost area, ghost red blood cells caused by thermal injury were observed (white arrow, HE staining, scale bar = 100 μm).
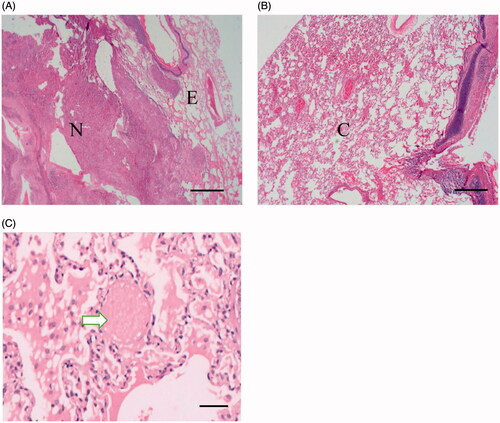
Figure 3. Comparison of imaging features of the VX2 tumor on CT and MRI pre- and post-MWA (scale bar = 1 cm). (A) The VX2 tumor was successfully implanted in the left lower lobe of the lung (arrow). (B) On 3D-VIBE-T1WI image, the tumor showed isointensity as compared with muscle (arrow). (C) On FS-TSE-T2WI image, the tumor showed hyperintensity as compared with muscle (arrow). Lung texture was barely visible on either 3D-VIBE-T1WI or on TS-FSE-T2WI image. (D) After the ablation, ground-glass opacity (arrow) was seen covering the tumor (triangle), and the border of the tumor was vague. (E) The tumor showed high signal intensity on 3D-VIBE-T1WI image after ablation (arrow) with a small area of centered isointensity (curve arrow). (F) The signal decreased on TS-FSE-T2WI image post-ablation (triangle). The ablation area demonstrated central low signal intensity, which corresponded to the thermally coagulated area in the pathological examination. The central area was surrounded by a high signal intensity rim (curve arrow) that could possibly correspond to the effusion area, while the outermost area showed higher signal intensity that could correspond to the congestion area (arrow).
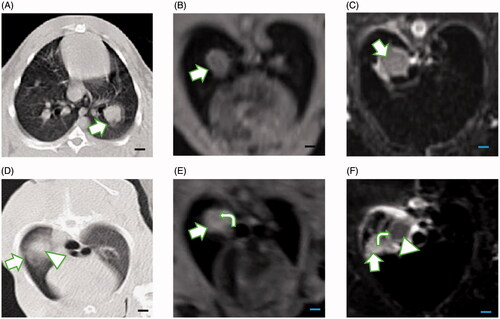
Figure 4. Boxplot showing the volumes of the VX2 tumors measured before microwave ablation, based on different imaging methods. Comparison of multiple-group means by ANOVA showed no statistically significant difference (p=.98). Note: We tagged the median with the blue rhombus. The upper boundary of the boxplot represents the third quartile of our data set, and the lower boundary represents the first quartile of our data set. The whiskers line indicates variability outside the upper and lower quartiles. The blue rhombus represents the median value of the data set.
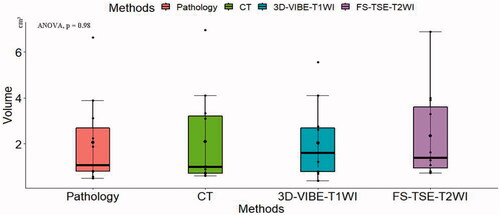
Table 3. The tumor volume on CT/MRI and pathological examinations.
Figure 5. Graphs showing correlations of the volumes of the ablated lesion measured with different imaging methods. Using the pathological examination as reference, in (A), the volumes of the ablated lesion measured on CT showed a positive linear correlation with the volumes determined by pathological examination, but their correlation was slightly weaker (r = 0.92) than that of the volumes determined by FS-TSE-T2WI (r = 0.96) (C). (B) The correlation with the pathologically determined volumes was the strongest for 3D-VIBE-T1WI (r = 0.99). The matrix of their correlations is showed in (D).
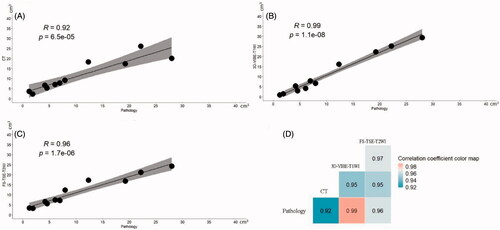
Table 4. The volume of ablated lesion on CT/MRI and pathological examinations.
Data availability statement
The data that support the findings of this study are available on request from the corresponding author.