Figures & data
Figure 1. Schwannoma cells forming multinodular masses (arrow) supported by a loose fibrovascular stroma (H&E stain, 100× magnification). The neoplastic cells showed strong cytoplasmic immunoreactivity for GFAP, laminin, and S100 (immunostaining, 100× magnification).
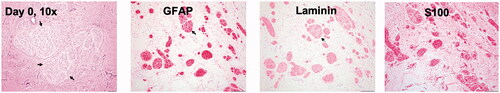
Figure 2. (A, B) Dry type FUS transducer for tumor treatment in an intubated dog lying on the right side. (C) FUS planning and targeting.
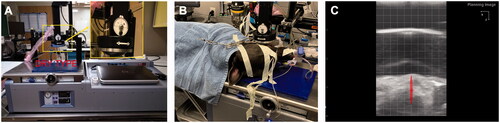
Figure 3. Treatment timeline and response rates. (A) Three partial FUS treatments (∼50% of tumor volume/session) were performed over 3 weeks. Tumor biopsies were collected before and after FUS treatment. HBOT was administered between day 10 to day 28. (B) Caliper measurements of the longest diameter of treated tumor after various FUS sessions. Complete local tumor remission was observed by the end of the 4th week; (C) Therapeutic efficacy evaluated with the response evaluation criteria in solid tumors (RECIST v1.1) suggested complete response at the treated site without emergence of new lesions at 3 months post-treatment (CR: complete response; PR: partial response; SD: stable disease).
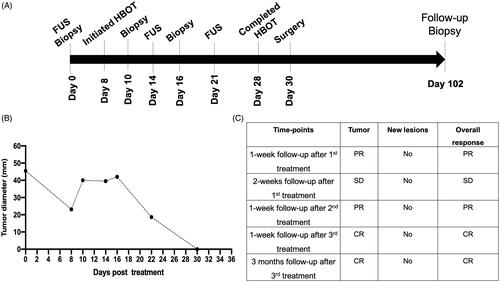
Figure 4. (A) Representative images of the treated tumor regions over 102 days. Complete remission of the treated tumor (arrow) was observed as time progressed. Briefly, necrosis and a calcified mass in the treated tumor were observed 1 week after the first FUS treatment and were associated with thermal burns (ellipse) of the regional buccal mucosa, probably because of high acoustic absorption and heating of the calcified mass during FUS treatment. The calcified mass was debrided on day 10. Additional FUS treatments were administered on days 14 and 21 to induce complete tumor remission. Longitudinal monitoring of the treated regions from days 25 to 102 showed an absence of the tumor in the treated region. (B) CT revealed a central gas filled defect in the left caudal maxilla (green arrow) in the area of FUS focus on days 30 and 102 post-treatment. New bone formation appeared to fill the depth of the osseous defect in the left caudal maxillary crest by day 30. A mild amount of amorphous new bone on the floor of the left orbital dorsal region of the removed soft tissue mass was also observed.
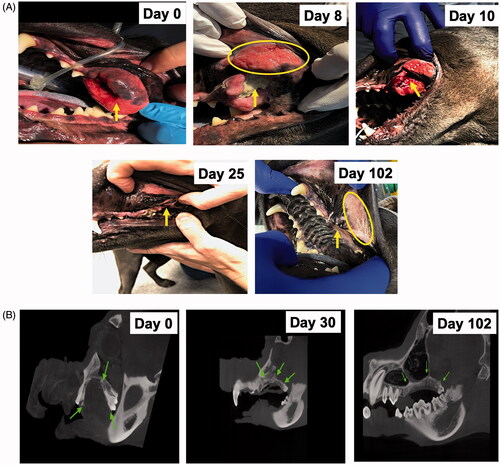
Figure 5. (A) HBOT device and setup. (B) A thermal burn (42 × 22 mm) was observed in the buccal mucosa (ellipse) region close to the treated tumor on day 8. (C) HBOT administration decreased the zone of thermal burns (24 × 10.4 mm; ellipse), as compared with the pretreatment levels. (D, E) The exposed bones underlying the tumors were closed with a gingival flap (arrow) after complete tumor remission and healing of thermal burns on day 30.
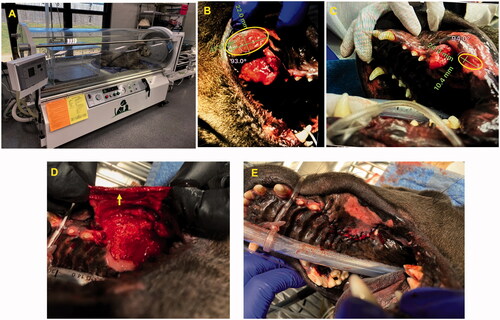
Figure 6. (A–C) Marked areas of coagulative necrosis within the mass, characterized by hyper-eosinophilic neoplastic cells lacking nuclear details. (D, H) Evaluation of treated regions on day 102 showed an absence of tumor cells with submucosa composed of collagen, fibroblasts (arrow head), and melanomomacrophages (arrow). (E–H) The tumor showed infiltrated neutrophils, lymphocytes, and macrophages admixed with tumor cells between day 10 and day 26, and they became rare by day 102.
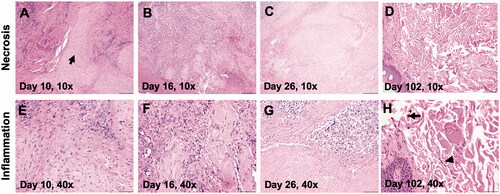
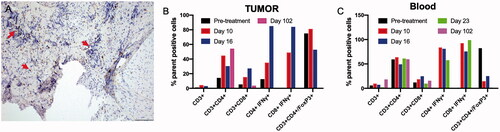
Figure 7. (A) A day 10 tumor biopsy sample showed low to moderate numbers of CD3+ lymphocytes surrounding the tumor cells (arrow, 200× magnification). (B, C) Trends in the treatment effects on T cells in the tumor and blood over time, relative to the pretreatment controls. FUS ablation increased the frequency of CD3+, and IFNγ expressing CD3+ CD4+ T cells and CD3+ CD8+ T cells at 1–3 weeks post-treatment in the tumor, as compared with the pretreatment levels. The population of T-cells became undetectable on day 102 in the tumor region. Similarly, an elevated population of IFNγ expressing CD3+ CD4+ T cells and CD3+ CD8+ T cells was observed in the blood 2–3 weeks post-treatment, and these cells became undetectable by day 102. A consistent decrease in the populations of the immunosuppressive Treg cells in the blood was observed post-treatment, and these cells became undetectable in both the blood and tumor by day 102.