Figures & data
Table 1. Hyperthermia institutes and available equipment.
Figure 1. Overview of the different clinical example cases, as discussed in this paper to illustrate clinical decision making facilitated by HTP. A treatment strategy should be formulated for the specific equipment available at the institute concerned. Patient models used in these examples were based on the virtual family models Duke and Ella [Citation54].
![Figure 1. Overview of the different clinical example cases, as discussed in this paper to illustrate clinical decision making facilitated by HTP. A treatment strategy should be formulated for the specific equipment available at the institute concerned. Patient models used in these examples were based on the virtual family models Duke and Ella [Citation54].](/cms/asset/8fcedb5c-afaa-4d2e-a444-14efc7e98a06/ihyt_a_1903583_f0001_c.jpg)
Table 2. Values of the dielectric properties at 13.56 MHz, 70 MHz, 90 MHz and 434 MHz used in the simulations [Citation57].
Table 3. Values of the density and thermal properties used in the treatment planning simulations [Citation58].
Figure 2. Simulated phase sweep optimization procedure for focusing to the bladder target region. The graph shows simulated average SAR values in the bladder for a phase sweep with the bottom, left and right antenna pairs of the Sigma-60 applicator, where the top antenna pair served as reference, i.e., phase 0°. This resulted in optimal phase settings of top:bottom:left:right (°) = 0:40:30:40.
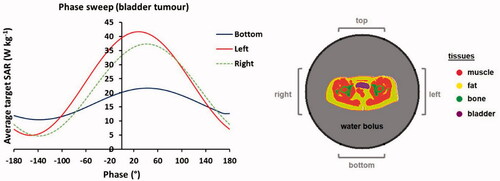
Figure 3. (A) Result of a mimicked clinical phase sweep optimization procedure, for heating with the Sigma-60 applicator. (B) Predicted SAR distribution for the optimized phase settings and an example of the correlation between predicted average SAR and measured T50 tumor temperatures for cervical cancer patients treated at institute A with the Sigma-60 applicator. The green contour in the SAR distribution indicates the target region.
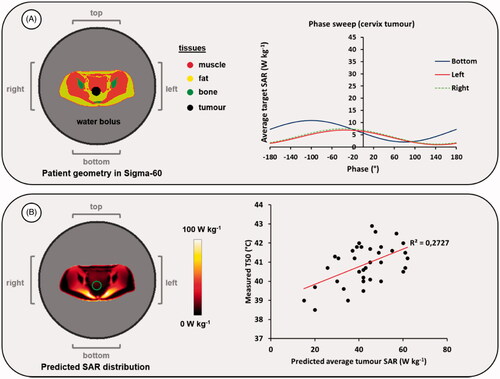
Table 4. Predicted temperatures (tumor T90, pubic bone hot spot temperature and overall maximum temperature in the patient volume, which was located at the lower back) after adjusting power and phase settings to resolve a hot spot at the pubic bone.
Figure 4. Predicted temperature distributions and temperature volume histograms for clinical settings yielding a hot spot complaint near the pubic bone, clinical settings with reduced power to resolve the hot spot complaint and alternative settings determined with help of HTP to also resolve the hot spot complaint, but with a higher thermal dose in the tumor as with the clinical settings with reduced power.
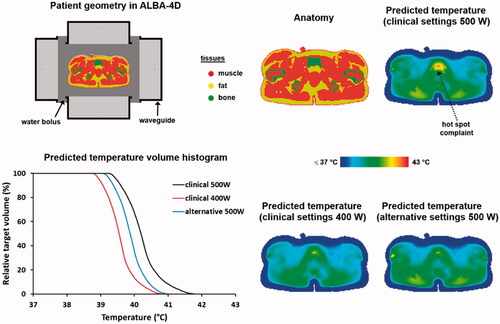
Figure 5. Predicted SAR (A) and temperature (B) distributions for two different electrode combinations, when heating a bladder cancer patient. The black contour in the temperature distributions indicates the bladder target. For temperature evaluation, the bolus temperatures at both ends of the clinically applied range were simulated (i.e., 18 °C and 10 °C) to ensure a robust conclusion regarding the optimal electrode combination, independent of the water temperature. Power was scaled such that the overall maximum predicted tissue temperature reached 45 °C. The displayed slice is at the central target location to visualize the effectiveness of target heating for different treatment setups with the same normal tissue constraints; the 45 °C maximum is not visible in this slice.
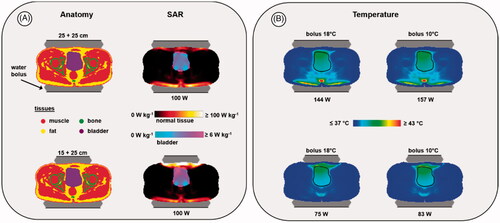
Table 5. Predicted SAR values and HTQ for two different electrode combinations when heating a bladder cancer patient. Total power was normalized to an arbitrary level of 100 W absorbed in the patient.
Table 6. Predicted indexed target temperatures for two different electrode combinations when heating a bladder cancer patient.
Figure 6. Predicted normalized SAR and temperature distributions, temperature-volume histograms and indexed temperatures for heating a melanoma in the upper leg using the superficial ALBA ON 4000 system, or the locoregional ALBA-4D system using only the top waveguide. The green and black contours in the SAR and temperature distributions represent the tumor target.
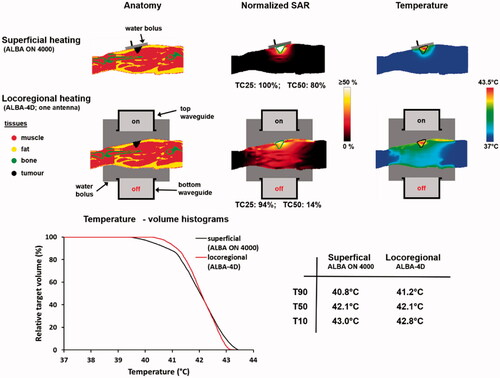
Figure 7. Two possible treatment strategies for heating two melanoma lesions; a single session using the ALBA-4000 ON Delta applicator, or two sessions using the Beta applicator.
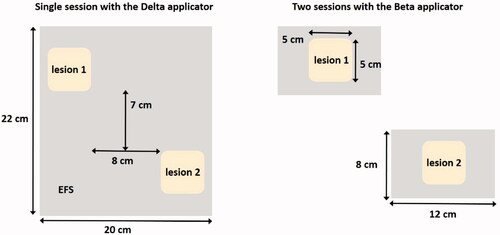
Figure 8. Predicted normalized SAR distributions and SAR-volume histograms for heating two melanoma lesions as in , in two sessions using the ALBA ON 4000 Beta applicator, or in one single session using the Delta applicator. The green contours in the SAR distributions represent the tumor target.
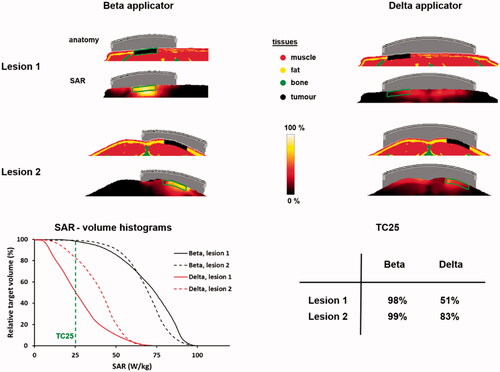
Figure 9. Predicted SAR and temperature distributions in case of a silicone breast implant, compared to a reference situation (top) without a breast implant. A total amount of absorbed power of 15 W was assumed. The green and black contours in the SAR and temperature distributions represent the tumor target.
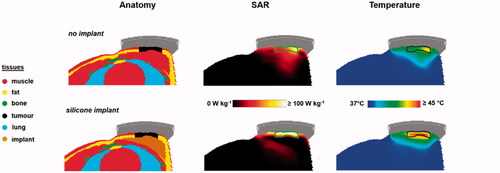
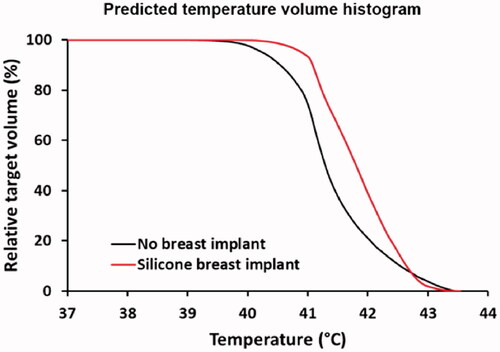
Figure 10. Predicted temperature volume histograms in case of a silicone breast implant, compared to a reference situation without a breast implant. Power was scaled such that the maximum temperature did not exceed 43.5 °C.