Figures & data
Figure 1. Sagittal view of MRI from a patient with uterine fibroid showed subcutaneous fat thickness (a); abdominal wall thickness (b); distance from the posterior surface of fibroid to the sacrococcyx (c).
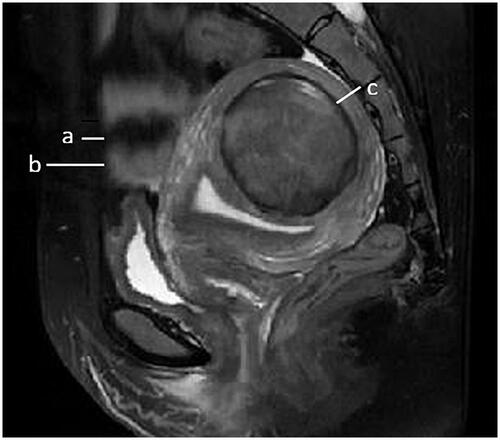
Figure 2. The measurements of MR parameters. A quantitative MR image was analyzed drawing an ROI within area of the fibroid, skeletal muscle, and the myometrium on one of the MR images. The software automatically calculate the quantitative parameters. (A) Signal intensity value of uterine fibroids and skeletal muscle; (B) the contrast-enhance signal intensity value of uterine fibroids and the myometrium.
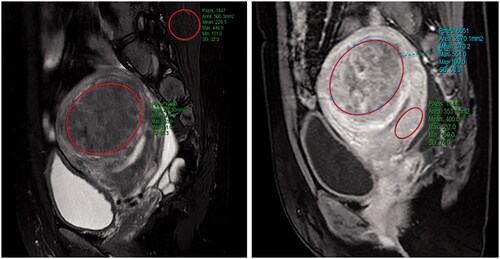
Table 1. Comparison of baseline characteristics between patients with an NPV ratio equal to or greater than 80% and patients with an NPV ratio less than 80%.
Figure 3. T1-weighted MR image obtained one day after HIFU treatment. (a) NPV ratio of at least 80%; (b) NPV ratio less than 80%.
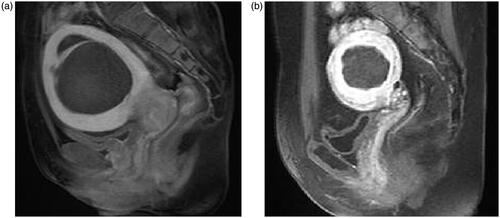
Table 2. Comparison of HIFU treatment results between patients with an NPV ratio equal to or greater than 80% and patients with an NPV ratio less than 80%.
Table 3. Logistical analysis of independent factors associated with an NPV ratio equal to or greater than 80% and an NPV ratio less than 80%.
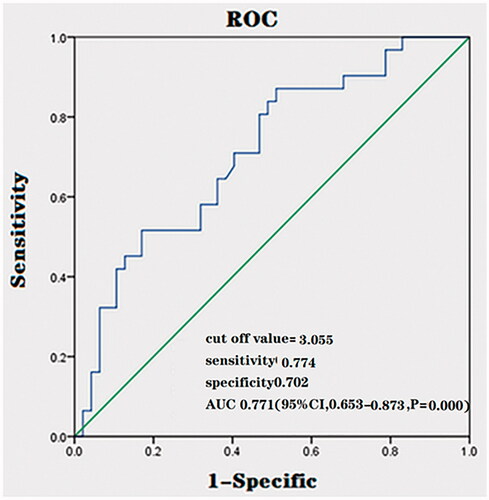
Figure 4. The ROC curves of the prediction model in predicting the treatment outcome of HIFU ablation with an immediate NPV ratio of at least 80%.
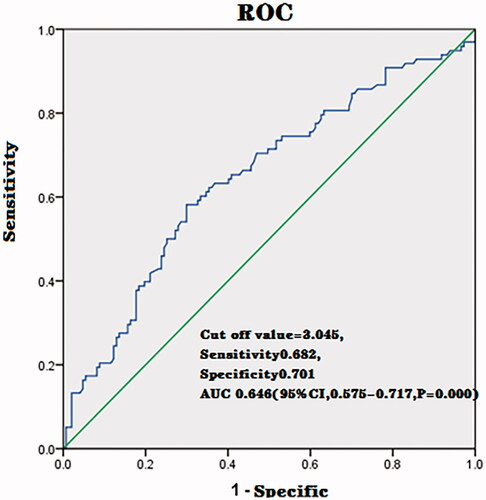
Table 4. Coefficient of multivariable regression model of EEF.
Table 5. Comparison of baseline characteristics between the internal and external group of patients.
Table 6. Comparison of treatment results between patients with an SI ratio of fibroid to muscle greater than 3.045 and patients with an SI ratio of fibroid to muscle equal to or less than 3.045 in external validation group.
Figure 5. The ROC curves of the validation model in predicting the treatment outcome of HIFU with an immediate NPV ratio over 80%.