
Figures & data
Figure 1. Patient with central recurrence in position within the MRI scanner with the HIFU device in place. T2-W image at planning study (a) and on day of treatment (b) after bowel and bladder preparation. In b, urinary and rectal catheters (black arrows) are noted in situ. The vagina is filled with degassed gel (white arrow).
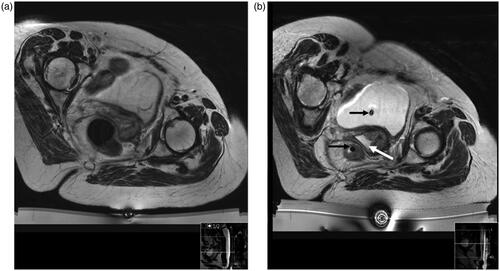
Table 1. Patient characteristics of those treated.
Figure 2. Box and whisker plot summarizing percentage change in NRS pain scores for (a) responders (green, n = 5) and non-responders (red, n = 6) and (b) intra-pelvic (green, n = 5) versus extra-pelvic (blue, n = 6) tumors. Median (central line) and upper and lower quartiles are indicated by the upper and lower boundaries of the box. The whiskers denote maximum and minimum values.
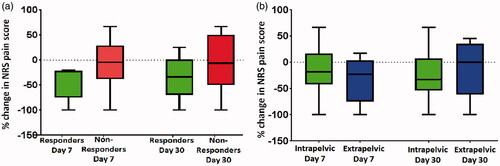
Figure 3. Comparison of worst pain score in responders (blue) and non-responders (red).
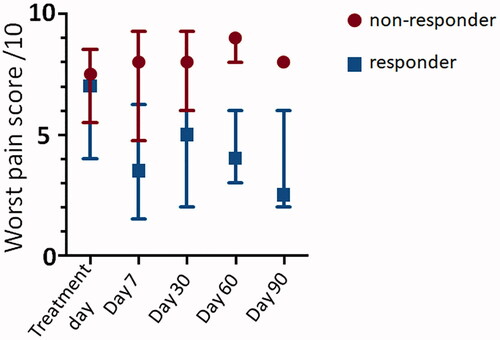
Table 2. Relationship of thermal energy delivered and dose to change in NRS pain score at each time-point.
Table 3. Percentage change in mean scores for each QoL feature.
Figure 4. Axial T1W image with fat suppression pulse and after contrast enhancement with gadolinium chelate before and after treatment of an extra-pelvic tumor. The pretreatment image shows the enhancing nodule of recurrent tumor in the left ischio-rectal fat (yellow arrow). Immediately post-treatment there is complete ablation of this enhancing lesion (yellow arrow).
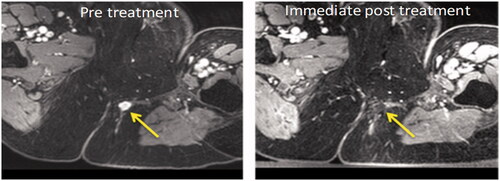
Table 4. Whole tumor and enhancing tumor volumes at baseline and longitudinal changes over 30 days.
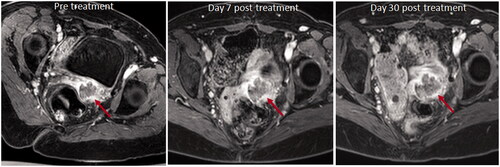
Figure 5. Axial T1W images with fat suppression pulse and after contrast enhancement with gadolinium chelate before and after treatment of an intra-pelvic tumor. The pretreatment image shows the non-enhancing tumor mass at the vaginal vault on the left (red arrow). There is no substantial change in tumor volume post treatment, either at Day 7 or Day 30, and no change in the relative enhancing and non-enhancing components (red arrows).
Data availability statement
Imaging data is available through the Cancer Research UK Imaging data repository (contact via study CI, N deSouza).