
Figures & data
Figure 1. General workflow of the novel optimization procedure for improved regional hyperthermia (RHT) planning using optimization of the so-called ‘Parametrized Treatment Models’ (PTMs) via a root-mean-square-deviation (RMSD)-based comparison between calculated and measured temperatures along tumor, rectal and bladder catheters. An oval form of boxes refers to measurement parts of the optimization scheme. The core parts of the optimization routine that are bounded by dashed lines are described in more detail in .
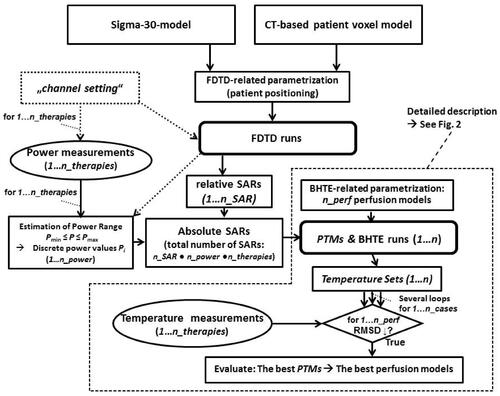
Figure 2. Details of the two-step optimization consisting of a ‘Coarse Step’ using the ‘homogeneous’ (H) ‘Perfusion Behavior Type’ (PBT), and a ‘Fine Step’ using either ‘non-dynamic’ (ND) or ‘dynamic’ (D) PBTs. The optimum whole-body perfusion level found by the Coarse Step (here m = m_best_H = 10 ml/100g/min) is used as a starting point for the Fine Parametrizations/Optimizations. For clarity, the particular numbers used for the case presented in the section Results are displayed in .
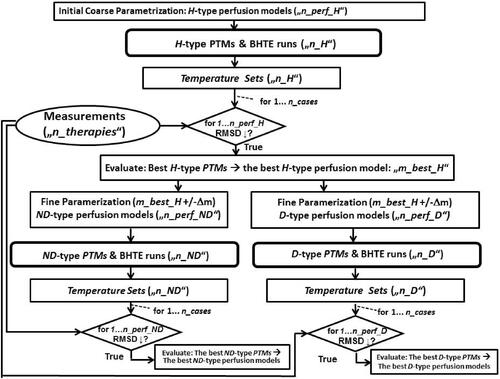
Figure 3. Parametrized treatment models (PTMs) for the case presented in the section Results, created as parameter combinations, involving: •two relative SAR distributions (‘central’ and ‘shifted’ patient positioning). •two therapies [‘Higher-Power’-Therapy (HP_THER) and ‘Lower-Power’-Therapy (LP_THER), each of them represented by a power range of absorbed power in patient, approximated by five power levels each thus resulting of a total of 20 absolute SAR distributions]. •three different PBTs [homogeneous (H) with 7 perfusion models, non-dynamic (ND) with 1350 perfusion models, and, dynamic (D) with 1536 perfusion models], resulting in the total number of PTMs of n = 57.860, equal to the total number of BHTE runs.
![Figure 3. Parametrized treatment models (PTMs) for the case presented in the section Results, created as parameter combinations, involving: •two relative SAR distributions (‘central’ and ‘shifted’ patient positioning). •two therapies [‘Higher-Power’-Therapy (HP_THER) and ‘Lower-Power’-Therapy (LP_THER), each of them represented by a power range of absorbed power in patient, approximated by five power levels each thus resulting of a total of 20 absolute SAR distributions]. •three different PBTs [homogeneous (H) with 7 perfusion models, non-dynamic (ND) with 1350 perfusion models, and, dynamic (D) with 1536 perfusion models], resulting in the total number of PTMs of n = 57.860, equal to the total number of BHTE runs.](/cms/asset/e2157d38-2804-42a9-af04-8ea4d264c7ba/ihyt_a_1909757_f0003_b.jpg)
Table 1. Clinically measured power and temperature values for two investigated therapies of a pediatric pelvic rhabdomyosarcoma: Higher-Power-Therapy (HP_THER) in the middle column, and Lower-Power- Therapy (LP_THER) in the right column.
Figure 4. A root-mean-squared-deviation (RMSD)-based minimization in Equation (7) for the best case in for the parameter combination [‘Higher-Power’-Therapy (HP_THER), ‘dynamic Perfusion Behavior Type’ (D_PBT), ‘Central Patient Positioning’ (CE_POS), P = 120 W absorbed power in patient]. Displayed are RMSD values for all (i_perf = 1…n_perf_D = 1536) dynamic (D)-type perfusion models, as defined in EquationEquation (13)(13)
(13) , associated with this case (indicated as ‘MODEL-NUMBER’ on the abscissa). The minimum RMSD was found for the index i_perf = 1001, i.e. for perfusion model D-1001. RMSD values range from 0.3882 °C (for i_perf = 1001) to almost 5 °C. The latter high RMSD values were obtained for low perfusion model indices, i.e. (too) low tumor and rectum perfusion values.
![Figure 4. A root-mean-squared-deviation (RMSD)-based minimization in Equation (7) for the best case in Table 3 for the parameter combination [‘Higher-Power’-Therapy (HP_THER), ‘dynamic Perfusion Behavior Type’ (D_PBT), ‘Central Patient Positioning’ (CE_POS), P = 120 W absorbed power in patient]. Displayed are RMSD values for all (i_perf = 1…n_perf_D = 1536) dynamic (D)-type perfusion models, as defined in EquationEquation (13)(13) m_tumor= 2.5→5 | 5→10 | 7.5→15 | 10→20m_rectum= 2.5→5 | 5→10 | 7.5→15 | 10→20m_bladder= 1.25→2.5 | 2.5→5 | 5→10m_muscle= 3.33→10 | 5→15 | 10→30 | 13.33→40m_fat= 1→3 | 2→6 | 2.5→7.5 | 3.33→10m_bone= 1.25→2.5 | 2.5→5,(13) , associated with this case (indicated as ‘MODEL-NUMBER’ on the abscissa). The minimum RMSD was found for the index i_perf = 1001, i.e. for perfusion model D-1001. RMSD values range from 0.3882 °C (for i_perf = 1001) to almost 5 °C. The latter high RMSD values were obtained for low perfusion model indices, i.e. (too) low tumor and rectum perfusion values.](/cms/asset/cd43e1d7-8ca2-4d1e-8b7a-8ba6d86f3211/ihyt_a_1909757_f0004_c.jpg)
Table 2. Tissue perfusion values in perfusion models exhibiting the non-dynamic (ND) and dynamic (D) Perfusion Behavior Type (PBT) in the optimization procedure described in , , and .
Table 3. Optimization results in terms of minimum root-mean-square-deviation (RMSD) values, as defined in EquationEquation (7)(7)
(7) , for the Higher-Power-Therapy (HP_THER) for both Optimization Steps (Coarse, Fine).
Table 4. Optimization results only for the ‘Lower-Power’-Therapy (LP_THER) in terms of minimum RMSD values, displayed in an analogous way to .
Table 5. Region perfusion values of all perfusion models reported in Tables 3 and 4.
Figure 5. Comparison of measured [for the Higher-Power-Therapy (HP_THER), black dashed curve with cross symbols] and calculated ‘Temperature Sets’ of the pelvic region along the tumor, rectal, and bladder catheters in 14 points: 5 in tumor catheter (0 cm corresponds to the caudal-medial catheter tip), 8 in rectal catheter (0 cm corresponds to anus), and one in bladder catheter, and Calculated results refer to the optimum Parametrized Treatment Models (PTMs) for each ‘Perfusion Behavior Type’ (PBT), respectively. These PTMs are indicated as follows: •‘H-4-centr-105 W’ (red, circle symbols) [homogeneous perfusion model H-4, central patient positioning (CE_POS), absorbed power in the patient model P = 105W]. •‘ND-1011-centr-120W’ (blue, square symbols) (non-dynamic perfusion model ND-1011, CE_POS, P = 120W), and, • ‘D-1001-centr-120W’ (purple, triangle symbols) (dynamic perfusion model D-1001, CE_POS, P = 120W). Region perfusion values are displayed in .
![Figure 5. Comparison of measured [for the Higher-Power-Therapy (HP_THER), black dashed curve with cross symbols] and calculated ‘Temperature Sets’ of the pelvic region along the tumor, rectal, and bladder catheters in 14 points: 5 in tumor catheter (0 cm corresponds to the caudal-medial catheter tip), 8 in rectal catheter (0 cm corresponds to anus), and one in bladder catheter, and Calculated results refer to the optimum Parametrized Treatment Models (PTMs) for each ‘Perfusion Behavior Type’ (PBT), respectively. These PTMs are indicated as follows: •‘H-4-centr-105 W’ (red, circle symbols) [homogeneous perfusion model H-4, central patient positioning (CE_POS), absorbed power in the patient model P = 105W]. •‘ND-1011-centr-120W’ (blue, square symbols) (non-dynamic perfusion model ND-1011, CE_POS, P = 120W), and, • ‘D-1001-centr-120W’ (purple, triangle symbols) (dynamic perfusion model D-1001, CE_POS, P = 120W). Region perfusion values are displayed in Table 5.](/cms/asset/59d77b40-f113-4778-818a-d0cc85760c75/ihyt_a_1909757_f0005_c.jpg)
Figure 6. Comparison of measured [for the Lower-Power-Therapy (LP_THER), black dashed curve with cross symbols] and calculated ‘Temperature Sets’ in points explained in the legend of Figure 6. Calculated results refer to those PTMs, which exhibited the minimum RMSD in , i.e. those which are the best for LP_THER only, for each perfusion behavior type (PBT), respectively. These PTMs are indicated as follows: •‘H-4-centr-93 W’ (red, circle symbols) (homogeneous PBT, CE_POS, p = 93 W). •‘ND-943-centr-108’ W (blue, square symbols) (non-dynamic PBT, CE_POS, p = 108 W), and •‘D-913-centr-108W’ (purple, triangle symbols) (dynamic PBT, CE_POS, p = 108 W). Region perfusion values are displayed in .
![Figure 6. Comparison of measured [for the Lower-Power-Therapy (LP_THER), black dashed curve with cross symbols] and calculated ‘Temperature Sets’ in points explained in the legend of Figure 6. Calculated results refer to those PTMs, which exhibited the minimum RMSD in Table 4, i.e. those which are the best for LP_THER only, for each perfusion behavior type (PBT), respectively. These PTMs are indicated as follows: •‘H-4-centr-93 W’ (red, circle symbols) (homogeneous PBT, CE_POS, p = 93 W). •‘ND-943-centr-108’ W (blue, square symbols) (non-dynamic PBT, CE_POS, p = 108 W), and •‘D-913-centr-108W’ (purple, triangle symbols) (dynamic PBT, CE_POS, p = 108 W). Region perfusion values are displayed in Table 5.](/cms/asset/a9df2f14-fc3b-4f37-a3b7-2ff808b44b0f/ihyt_a_1909757_f0006_c.jpg)