
Figures & data
Figure 1. A flowchart of the patient selection process.
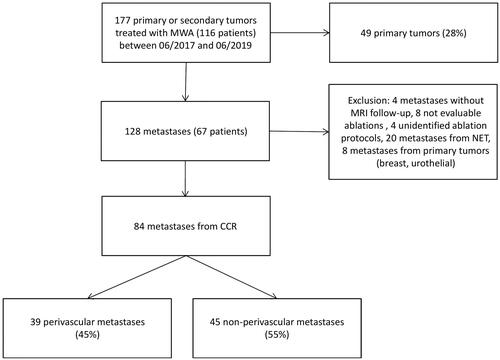
Table 1. Table detailing the exact vessel, their number and the distances between vessels and metastasis for PV tumors.
Figure 2. Minimal ablation margins measurement method. Axial T1 weighted MRI after intravenous contrast injection with an acquisition during the portal phase before microwave ablation (1) and after ablation (2). The method compared the first pre- and post-ablation MRI after contrast injection in the portal phase measuring multiple distances (a1, b1, c1, d1, e1) between the tumors (black arrow in 1) and anatomic landmarks and ablation zone (black dotted arrow in 2) and anatomic landmarks (A1, B1, C1, D1, E1) (). For each landmark, the pre-ablation distance was subtracted from the post-ablation distance to render the margin at that site (a1-A1, a2-A2…). The smallest value was considered as the minimal margin (a1-A1 in the example).
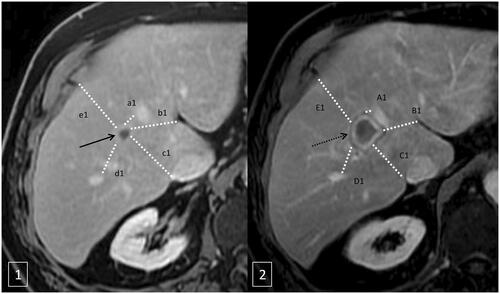
Figure 3. 80-year-old-man with colorectal cancer and a unique liver metastasis (black arrow) close to a segmental portal vein (black doted arrow). A and B represent a coronal and axial T1 weighted MRI after intravenous contrast injection with an acquisition during the portal phase before microwave ablation. C represents the aspect of the ablation zone on T1 weight MRI one month after treatment. Without injection of contrast the ablation zone appears hyper intense (white arrow). D, E and F are a coronal and axial T1 weighted MRI without injection (F) and with intravenous injection of contrast (D and E) during portal phase, three months after microwave ablation representing a growing tumor (dotted line) poorly enhanced abutting the ablation zone and the portal vein.
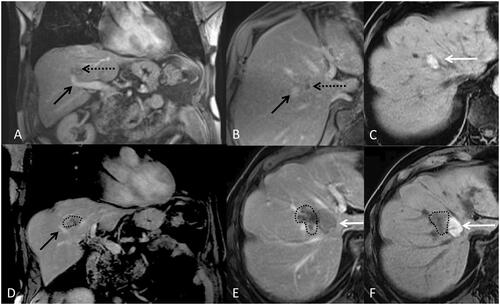
Table 2. Table representing patients’ characteristics for the group of perivascular ablations and the group of non-perivascular ablations.
Table 3. Table showing univariate analysis of factors affecting LTP for perivascular metastases.
Figure 4. Box plot showing the ratio of diameters of the short axes (left) and the ratio of diameters of the long axes (right) of ablation zones (dimensions on MRI one month after MWA/dimensions on manufacturer’s charts) concerning conventional protocol (black) and optimized protocol (grey).
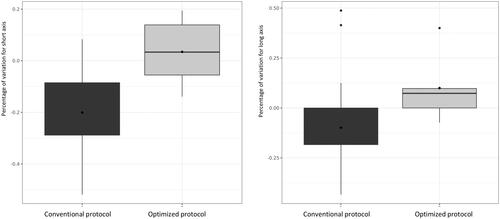
Figure 5. Graph of time to LTP (p = 0.49), recurrence free survival (p = 0.52) and overall survival (p = 0.54) for perivascular metastases (dotted line) and non-perivascular metastases (full line).
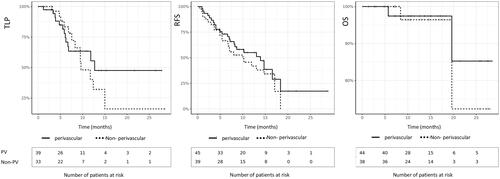
Figure 6. Patient followed for recto sigmoid adenocarcinoma with synchronous bi-lobar hepatic metastases. Ten FOLFOX cures were performed. The good response to this neoadjuvant treatment made it possible to perform liver surgery by left hepatectomy, on histological examination, two tumors compatible with a Lieberkühnien adenocarcinoma moderately differentiated and tumor regression TRG3 with complete exeresis. A few months later, appearance of two tumors of less than 2 cm in the liver treated by stereotactic radiotherapy. A few months later, recurrence on the hepatectomy slices with MTB decision to perform a percutaneous thermo-ablation. Images A and B are axial (A) and coronal (B) reconstruction scans with intravenous injection of contrast material at portal phase showing metastasis (black arrow) and vascular contact with the right suprahepatic vein (white dotted arrow) and the portal branch of segment VIII (white arrow). Image (C) is a T1-weighted axial MRI acquisition after injection of gadolinium portal phase, showing stereotactic radiotherapy sequellae as a hyper vascularization zone (black asterix). A few weeks later, an alteration in the general state appeared, with evidence of septic thrombosis of the right hepatic vein. Images E and F are scanner acquisitions after intravenous injection of contrast medium at portal phase, showing a probable abcedation of the microwave zone with the presence of a hydroaerous level (black dotted arrow) and fistulization of the right atrium. This case highlights the precautions to be taken in the treatment of CRC metastases close to large vessels by microwave on a weakened hepatic parenchyma. Indeed, the modification related to radiotherapy combined with the effect of microwaves is probably responsible for this complication.
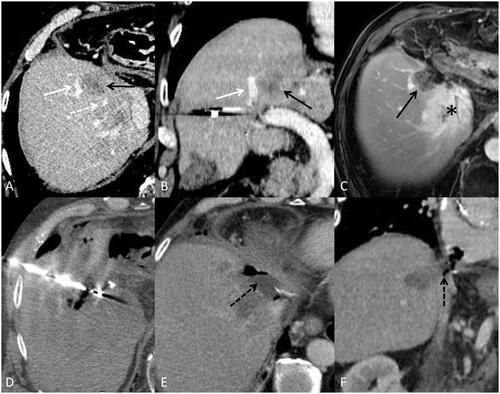
Table 4. Table showing LTP rates according to margin size and Kras mutation.