Figures & data
Figure 1. Schematic of the custom-made H-FIRE pulse generator.
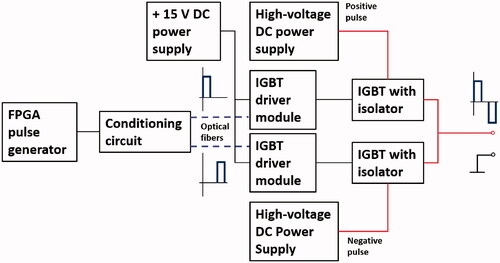
Figure 2. In vivo experimental setup: (a) designed H-FIRE pulses, (b) conventional IRE pulses, (c) H-FIRE voltage and current pulses for 0.3-1-0.3 at 2500 V, (d) for 1-1-1 at 2000 V, (e) electrode configuration, including a fiber optic temperature probe, (f) experimental H-FIRE or IRE ablation set up, including an accelerometer, and (g) harvested tissue cube with the ablation area.
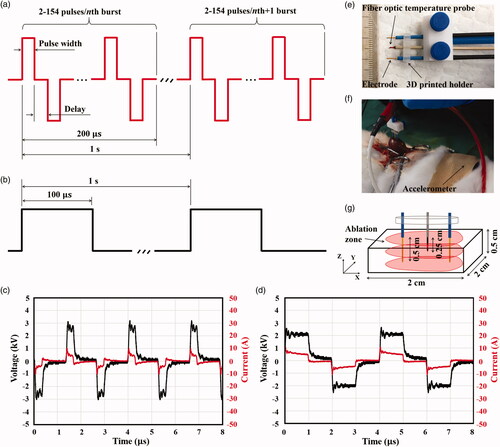
Table 1. Ablation protocols evaluated in the current study.
Figure 3. Histology of liver and kidney 72 h post-H-FIRE, H&E staining. (a) Liver ablation zone (five-pointed star), intact zone (four-pointed star), and transition zone (six-pointed star) with inflammation cells, bile duct proliferation, and fibrosis (triangle), 10x. (b) Kidney ablation zone (five-pointed star), intact zone (four-pointed star), and transition zone (six-pointed star) with inflammation cells, 10x. (c) Liver ablation zone with complete cellular necrosis, 20x. (d) Kidney ablation zone with complete cellular necrosis, 20x. (e) Liver intact zone with a capillary (arrow), 20x. (f) Kidney intact zone with visible glomeruli (arrows), 20x. (g) Inflammatory cells in the liver ablation zone (diamond), 10x. (h) A blood vessel in the kidney transition zone (arrows), 20x.
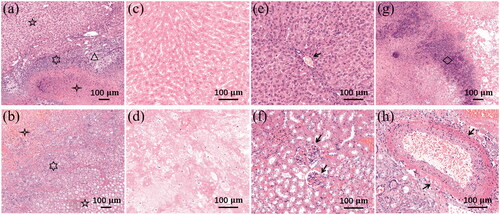
Figure 4. Representative images of ablation zones examined 72 h after treatments for (a) Liver and (b) kidney (the number on the figure denotes the protocol number).
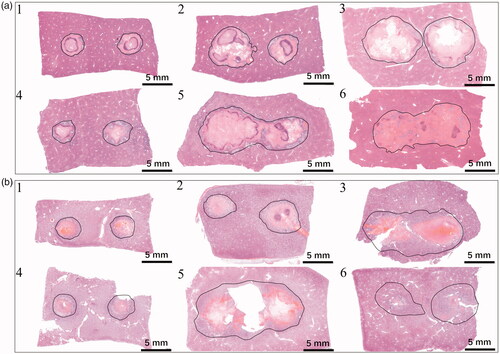
Figure 5. Comparisons of the ablation zone areas between (a) liver and kidney for each ablation protocol in (b) liver and (c) kidney, (d) P1 and P2 in liver, (e) P4 and P5 in liver, (f) P1 and P2 in kidney, (g) P4 and P5 in kidney, and (h) P1 and P3 in liver, (i) P1 and P3 in kidney, (j) P3 and P5 in liver, and (k) P3 and P5 in kidney. **p < 0.05, and ***p < 0.01 (error bar represents standard deviation).
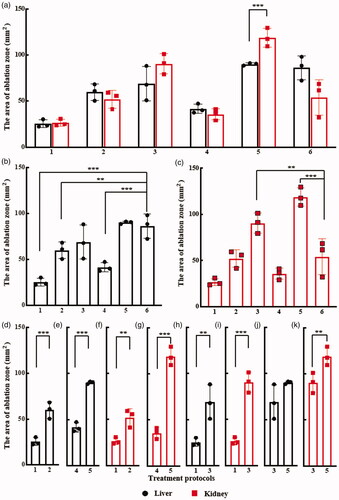
Figure 6. Representative muscle contraction accelerations of (a) P2, (b) P5, and (c) P6 for liver and (d) P2, (e) P5, and (f) P6 for kidney. (red, blue, and black lines represent the accelerations along the x, y, and z axes, respectively).
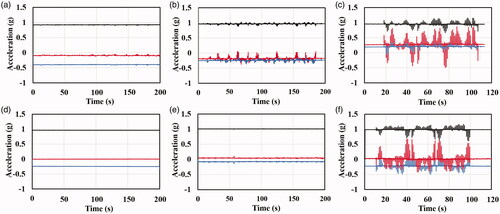
Figure 7. Average temperature increases () of P1-P6 for (a) liver and (b) kidney.
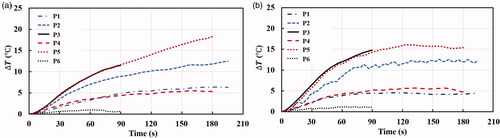
Table A1. Results of ablation zone in all protocols for liver and kidney tissues.
Table A2. H-FIRE protocols evaluated for thermal effect.
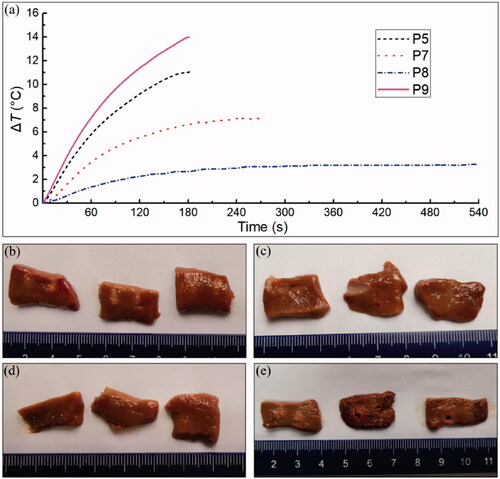
Figure A1. Average temperature increases () of P5, P7-P9 in the ex vivo porcine liver experiment (a) and thermal effects of P5 (b), P7(c), P8 (d), and P9 (e).