Figures & data
Figure 1. Patient selection flowchart. PLC: primary lung cancer; MWA: microwave ablation; NSCLC: non-small cell lung cancer; SCLC: small cell lung cancer.
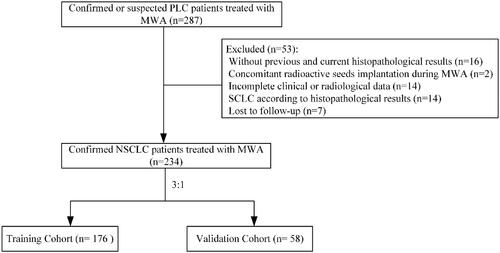
Table 1. Clinical characteristics of NSCLC patients treated with MWA.
Table 2. The detailed kinds of TKIs for NSCLC patients treated with MWA.
Table 3. Complications of NSCLC patients treated with MWA.
Figure 2. Forrest plot of the OS (with 95%confidence intervals) of NSCLC patients treated with MWA.
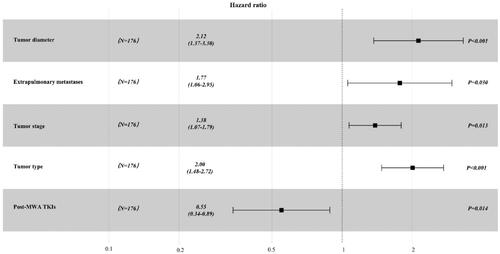
Figure 3. Kaplan–Meier analyses of OS. (a) The median OS were 41.0 months for patients with adenocarcinoma, 12.0 months for patients with squamous cell carcinoma, and 8.0 months for patients with other types. (b) The median OS were 39.0 months for patients with Stage I, 24.0 months for patients with Stage II, 21.0 months for patients with Stage III and 15.0 months for patients with Stage IV. (c). The median OS was 35.0 months for patients with <3 cm in diameter compared with 16.0 months for patients with ≥3cm in diameter. (d) The median OS was 36.0 months for patients with post-MWA TKIs compared with 17.0 months than those patients without. (e) The median OS was 13.0 months for patients with extrapulmonary metastases compared with 36.0 months than those patients without.
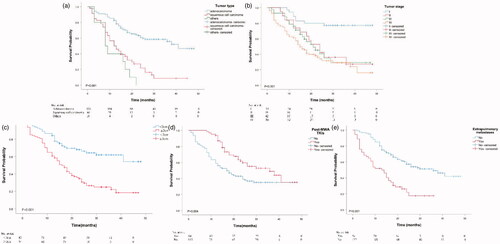
Table 4. Univariate analyses for OS of NSCLC patients treated with MWA in the training cohort.
Figure 4. (a). Prognostic nomogram for predicting OS in NSCLC patients treated with MWA. To use the nomogram, an individual patient’s value is located on each variable axis, and a line is drawn upward to determine the number of points received for each variable value. The sum of these numbers is located on the Total Point axis, and a line is drawn downward to the risk axes to determine the likelihood of median OS. The linear predictor represented the product of the independent variable and correlation coefficient. (b) OS of low-risk and high-risk group in the entire cohort.
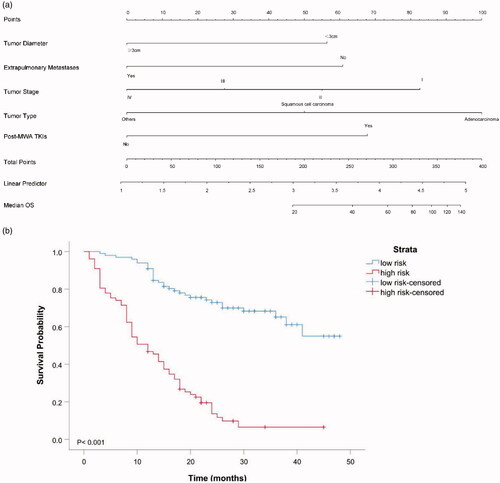
Figure 5. Receiver operating characteristic curve analyses for the nomograms in internal and external validation. The diagonal red line indicates that the index of AUC was 0.5, which was a reference value. C-statistic was calculated as the area between the ROC curve (blue curve) and horizontal axis. (a) The area under the curve (C-statistic) was 0.838 (95% CI, 0.779-0.897) in the training cohort for predicting OS. (b) The area under the curve (C-statistic) was 0.808 (95% CI, 0.695–0.920) in the validation cohort for predicting OS.
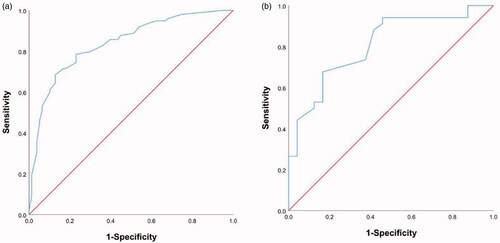
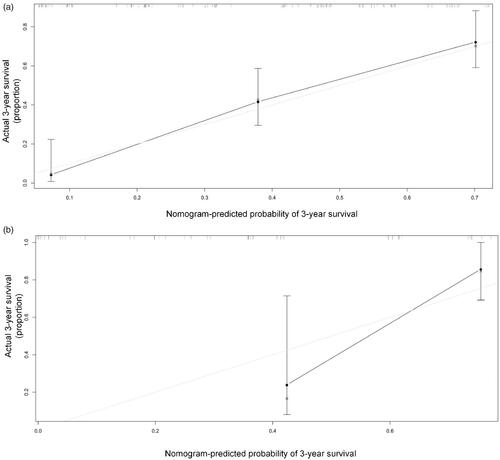
Figure 6. (a) Calibration curve for predicting 3-year survival after MWA in the training cohort. (b) Calibration curve for predicting 3-year survival after MWA in the validation cohort. The diagonal dotted line is a reference value while the solid line is curve fitting line.