Figures & data
Figure 1. Main components of the skin cooling system. (a) Schematic of the cart components including pumps, degasser and water reservoir. The cart is designed to be placed under a countertop work space and is sited in the MR control room. (b) Schematic of the control box that contains feedback control electronics and all power switches. The control box is placed adjacent to the MRgFUS control computer for ease of access. A separate dissolved oxygen meter is placed by the control box in order to monitor the dissolved oxygen content in the water reservoir. (c) Skin-cooling pillow assembly. Insulated input and output tubes are routed into the MRI suite via the waveguide and quick connect attachments are attached to the skin-cooling pillow. The pillow should be inspected before every treatment.
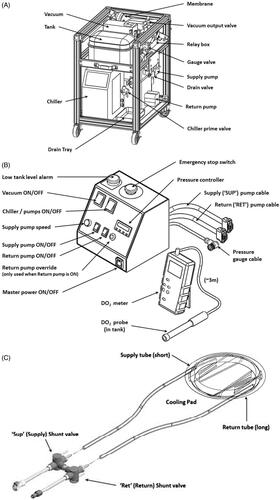
Figure 2. Simplified plumbing diagram indicating the role of each component located on the component cart. Loop (A) chills the coolant while loop (B) delivers the coolant to the skin cooling pad assembly.
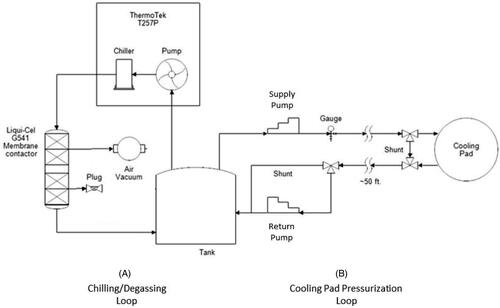
Figure 3. Skin cooling pillow configuration used for hydrophone tests. (a) Small-scale skin-cooling pillow (with channels) placed in the near field of the focused ultrasound beam for hydrophone testing. (b) Transverse profile of the pressure measured under water only and skin-cooling pillow conditions with and without channels. No beam profile distortion occurs with the skin-cooling pillow in place. Pressure decreases 5–12% depending on the presence of channels in the near-field of the ultrasound beam.
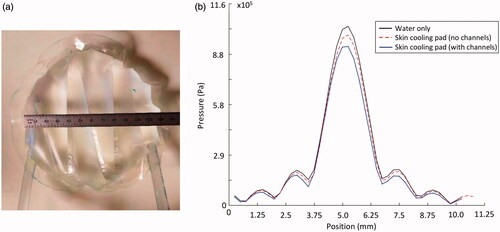
Figure 4. Experimental setup for the MRgFUS studies. In all cases a schematic focus is shown 1 cm from the subject interface. (a) Gelatin phantom placed on the skin-cooling pillow with the placement of the single loop MRI receive coil indicated schematically. Axial T1-weighted images of porcine subject (b) with hind leg coupled to the skin-cooling pad assembly and (c) in the control setup where no skin-cooling pad was utilized.
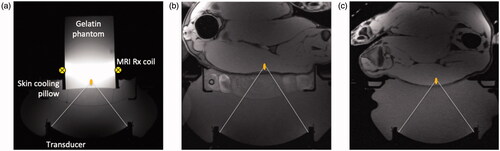
Figure 5. Sonication matrix parameters applied to both the control and skin-cooling ablation sides in the porcine model. In all cases, the power for individual sonications were adjusted to achieve a 65 °C peak temperature, independent of the heating or cooling times.
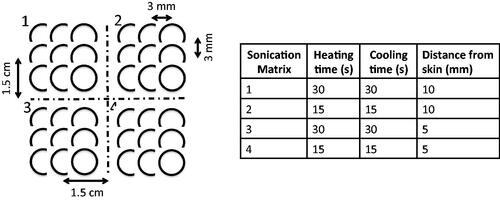
Figure 6. Effect of flow on MR temperature imaging. Results from sagittal MRTI acquisition in a gelatin phantom acquired during flow off and flow on conditions. (a) Peak temperature achieved in the phantom during both flow conditions. 2D temperature image in the sagittal plane and shown for the (b) flow off and (c) flow on conditions. The skin-cooling pillow placement is indicated by the white lines. White scale bar in (b) is 1 cm with an equivalent scale in (c).
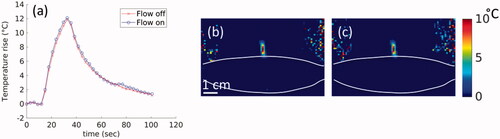
Figure 7. Demonstration of skin-cooling pad assembly conformability and acoustic coupling ability to four potential anatomical targets in a healthy volunteer. Axial T1w images are shown with the skin cooling pad coupled to (a) posterior knee, (b) inferior to the clavicle, (c) abdomen and (d) upper thigh. The subject is positioned prone in (b) and (c) and supine in (a) and (d). The skin-cooling pad assembly used in these tests had more interior channels that what is shown in .
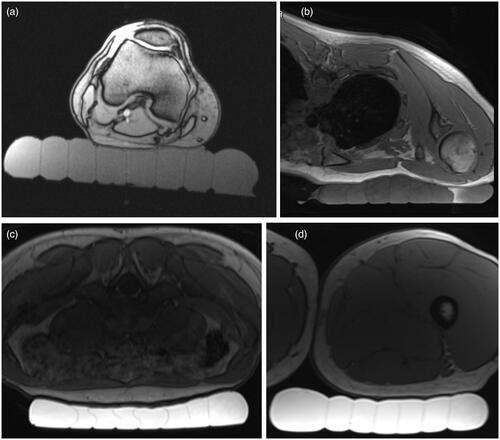
Table 1. Energy applied at each of the sonication matrices as defined in .
Figure 8. Comparison of control and skin-cooling conditions in animal 2. Cumulative thermal dose is overlaid on an axial T2-weighted image obtained at the end of the sonication period. Sonication matrices are labeled for both the (a) control and (b) skin-cooling conditions. The low thermal dose accumulation in the control condition, grid 4, was partially due to low image SNR from the MRI coil slipping from its original position.
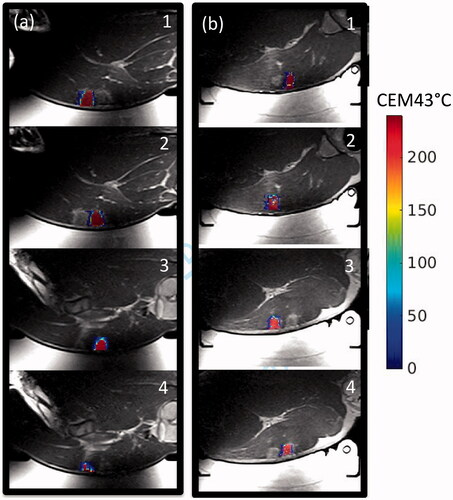
Table 2. Volume (cm3) that achieved a cumulative thermal dose of >240 CEM43 °C for each sonication matrix.
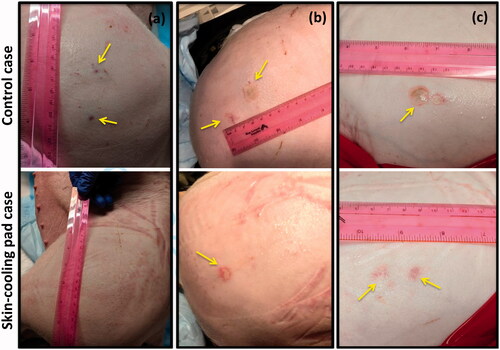
Figure 9. Gross assessment of the skin immediately post experiment. Any burns or other marks were noted for animals (a) 1, (b) 2 and (c) 3. The control condition side is shown in the top image with the skin-cooling condition shown in the bottom image. Burns or other marks are indicated with yellow arrows. The sonication matrices that resulted in burns or marks are indicated in .