Figures & data
Figure 1. Effect of different Ra-223 concentrations (0 to 6400 Bq/mL) on prostate cancer cell proliferation. Data points represent mean, and error bars represent standard deviation. All treatment groups were compared with the control group using a linear model and two-sided statistical tests. In all cell lines, 5-day exposure to Ra-223 produced dose-dependent reduction in cell proliferation. A Ra-223 dose of ≥ 800 Bq/mL resulted in significant reduction in cell proliferation at day 3 for all three cell lines.
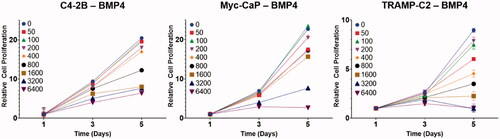
Figure 2. Response of prostate cancer cell lines to in vitro electroporation. Cell viability was not significantly affected at field strengths up to 500 V/cm. Effect on viability was detected at ≥750 V/cm. Viable cells were nearly undetectable for TRAMP-C2–BMP4 and Myc-CaP–BMP4 at 2000 V/cm and for C4-2B–BMP4 at 2500 V/cm.
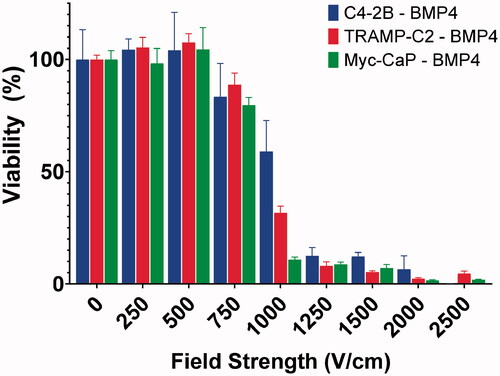
Figure 3. Combinatorial effect of Ra-223 and electroporation on the viability of prostate cancer cell lines. Ra-223 (1600 Bq/mL) in combination with reversible electroporation (RE; 500 V/cm) produced significantly greater reduction in cell viability in three BMP4-expressing prostate cancer cell lines than electroporation or Ra-223 alone.
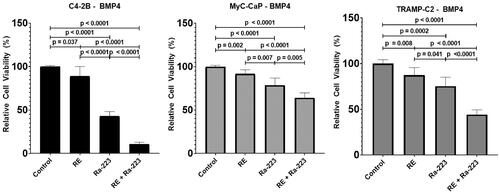
Figure 4. In vivo combinatorial effect of Ra-223 and IRE. Tumor growth was measured over the course of 28 days in nude mice bearing C4-2B-BMP4 xenografts. Tumor size was measured using bioluminescence and direct measurement by caliper. (A) Photographs overlaid with bioluminescence imaging of subcutaneously inoculated C4-2B–BMP4 cells. (B) Tumor size measured by caliper. (C) Measurement of total flux in tumor site indicating significant decline of bioluminescence signals in IRE and IRE plus Ra-223 tumors compared to tumors treated with Ra-223 or control.
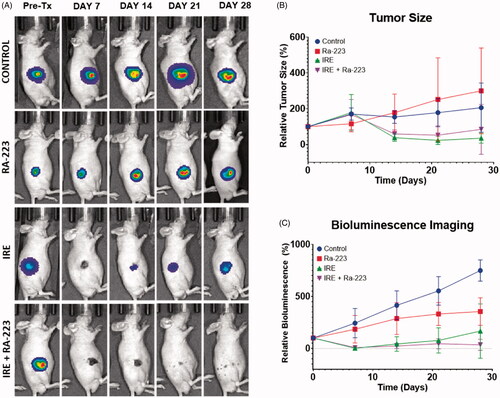
Figure 5. Tumor-free survival in IRE-treated mice. (A) Bioluminescence imaging of all mice (n = 5/group) with apparently complete ablation with IRE 1 day post-treatment. Four weeks after treatment, 2 out of 5 IRE-treated mice showed reemergence of signal while no signal reemergence was observed in mice treated with a combination of IRE and Ra-223. (B) All mice treated with IRE plusRa-223 were tumor-free 28 days after treatment, compared to only 60% in IRE-treated mice.
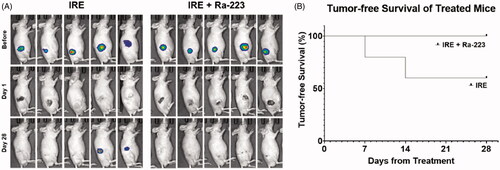
Figure 6. Quantification of (A) calcification and (B) necrosis in C4-2B-BMP4 tumors at 1 and 4 weeks after treatment. Percentage calcification and necrosis from the control (no treatment), Ra-223, IRE, and Ra-223 plus IRE groups were calculated from Von Kossa- and H&E-stained tumor sections, respectively.
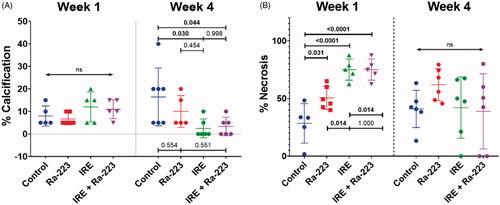
Figure 7. Patterns of necrosis following treatment showing Ra-223 enhances necrosis proximal to regions of calcification. Histology of C4-2B–BMP4 tumors (T) 1 week after treatment shows higher necrosis (N) in regions immediately proximal to sites of calcification (C) when treated with Ra-223. Necrosis in IRE-treated tumors shows more necrosis toward the center of tumor with more viable cells toward the tumor boundary (demarcated by dashed red line). Similar to Ra-223 alone, IRE plus Ra-223 shows enhancement of necrosis adjacent to sites of calcification.
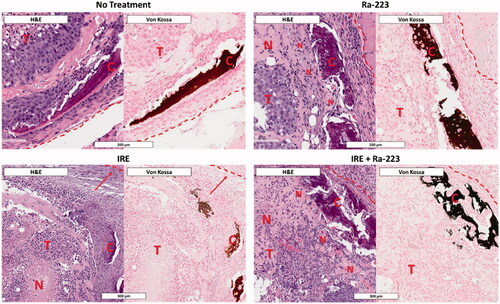
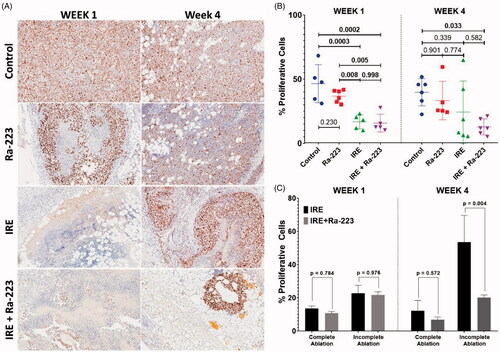
Figure 8. Cell proliferation in C4-2B–BMP4 tumors at 1 week and 4 weeks after treatment. (A) Representative Ki67-stained tumor sections from the control, Ra-223, IRE, and Ra-223 plus IRE groups. The % cell proliferation was calculated as the percentage of tumor area with Ki-67 staining. (B) Comparison of % cell proliferation by Ki-67 staining at 1 week using a one-way ANOVA followed by Holm-Sidak post-hoc analysis were as follows: control versus Ra-223, p = 0.300; control versus IRE, p < 0.001; control versus IRE plus Ra-223, p < 0.001; Ra-223 versus IRE, p = 0.008; Ra-223 versus IRE plus Ra-223, p = 0.005; and IRE versus IRE plus Ra-223, p = 0.998. Comparison of % cell proliferation at 4 weeks were as follows: control versus Ra-223, p = 0.437; control versus IRE, p = 0.480; control versus IRE plus Ra-223, p = 0.036; Ra-223 versus IRE, p = 0.999; Ra-223 versus IRE plus Ra-223, p = 0.611; and IRE vs. IRE plus Ra-223, p = 0.485. (C) Comparison of % cell proliferation between tumors treated with IRE and IRE plus Ra-223 after segregating based on completeness of ablation. Statistically significant increase in % proliferative cells is noted for incompletely ablated tumors treated with IRE only (53.58 ± 16.0%) compared to IRE plus Ra-223 (20.12% ± 1.63%; p = 0.004).